
Stocks Entering Period of Seasonal Strength Today:
 (NYSE:TOT) Seasonal Chart")
Total S.A. (ADR) (NYSE:TOT)) Seasonal Chart
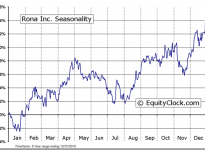
RONA (TO:RON) Seasonal Chart
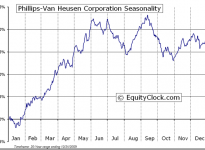
Phillips-Van Heusen (NYSE:PVH)) Seasonal Chart
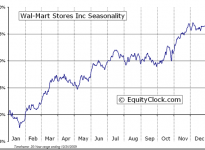
Wal-Mart Stores (NYSE:WMT) Seasonal Chart
 Seasonal Chart")
People’s United Financial, Inc. (NASDAQ:PBCT)) Seasonal Chart
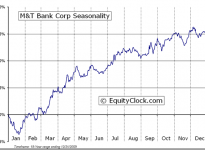
M&T Bank Corporation (NYSE:MTB)) Seasonal Chart
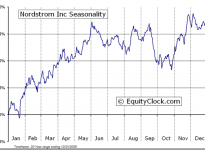
Nordstrom, Inc. (NYSE:JWN) Seasonal Chart
The Markets
Stocks traded on either side of the flatline on Tuesday as investors awaited the State of the Union Address, delivered on Tuesday evening. Investors often scrutinize the speech for any potential influences on equity market sectors for the year ahead. The equity market has generally reacted positively in the session following this event.
Since 1966, the S&P 500 Index has gained in 58% of sessions that have followed, averaging a slight gain of 0.09%. The average gain and frequency of success grows looking 7 and 30 days following the event. The large-cap index has gained around 64% of the time 7 and 30 days following the address, averaging a return of 0.30% and 1.33%, respectively. However, this is a pre-election year, and, as we’ve stated in the past, the President strives to be accommodative and business friendly during these periods as he seeks re-election of either himself or his party.
Gains for the equity market during pre-election years are typically more than double that of an average year. As a result of this business friendly approach, the average gain following the State of the Union Address tends to be significantly more than average years. The S&P 500 has gained in 10 of the past 12 sessions following the State of the Union Address during pre-election years, averaging a gain of 0.53%. Looking out 7 and 30 days during pre-election years has yielded gains in 75% of the periods, averaging returns of 0.80% and 3.27%, respectively.The three pre-election years that didn’t record a gain 7 or 30 days out (1979, 1999, and 2003) still recorded gains for the entire year averaging 19%, inline with the historical average for pre-election years. The third year in the presidential election cycle can hold significant potential for equity markets, assuming negative catalysts don’t interrupt the positive influence.
| S&P 500 Index returns following the State of the Union Address during Pre-Election Years | |||
| 1-Day Following | 7-Days Following | 30-Days Following | |
| 2011 | 0.42% | 1.27% | 1.16% |
| 2007 | 0.85% | 0.06% | 1.99% |
| 2003 | 0.68% | -1.20% | -2.48% |
| 1999 | 0.37% | 0.02% | -1.18% |
| 1995 | 0.34% | 0.98% | 4.52% |
| 1991 | 1.51% | 4.59% | 9.30% |
| 1987 | 0.60% | 0.82% | 3.36% |
| 1983 | -0.15% | 0.85% | 5.54% |
| 1979 | 0.66% | -1.22% | -3.37% |
| 1975 | -0.12% | -0.55% | 12.97% |
| 1971 | 0.42% | 1.05% | 1.96% |
| 1967 | 0.80% | 2.93% | 5.49% |
| Average | 0.53% | 0.80% | 3.27% |

While activity in the equity market remained rather stagnant on Tuesday, the currency market continued to chart significant moves, particularly the Canadian Dollar, which ended at a new five and a half year low. Since July of last year, the Canadian currency has made a parabolic move lower, following the price of oil; the dollar is now the most oversold since January of last year, just ahead of a basing pattern that brought upon higher levels into the summer. This end of January low in the Canadian dollar is seasonally typical; the currency tends to strengthen in the spring, once again following the price of oil. The seasonal low in the Canadian Dollar, which occurs on January 29th, on average, may be near given the oversold nature of the currency. The trend remains firmly negative, as characterized by lower-highs and lower-lows, over a short, intermediate, and long-term scale. Investors should be on the lookout for a bottoming pattern that will support the seasonal trade into the spring months.


Sentiment on Tuesday, as gauged by the put-call ratio, ended bullish at 0.80.

Sectors and Industries entering their period of seasonal strength:


Seasonal charts of companies reporting earnings today:


S&P 500 Index


TSE Composite


Horizons Seasonal Rotation ETF (TO:HAC)
- Closing Market Value: $15.13 (up 0.87%)
- Closing NAV/Unit: $15.16 (up 1.05%)
Performance
| 2015 Year-to-Date | Since Inception (Nov 19, 2009) | |
| HAC.TO | 0.20% | 51.6% |
* performance calculated on Closing NAV/Unit as provided by custodian

Disclaimer: Stocks highlighted are for information purposes only and should not be considered as advice to purchase or to sell mentioned securities. As always, the use of technical and fundamental analysis is encouraged in order to fine tune entry and exit points to average seasonal trends.