
Stocks Entering Period of Seasonal Strength Today:
 Seasonal Chart")
Freeport-McMoRan Copper & Gold (NYSE:FCX)
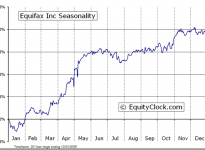
Equifax (NYSE:EFX) Seasonal Chart
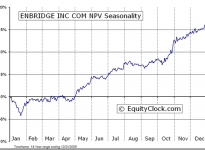
Enbridge (TO:ENB)
 Seasonal Chart")
Southwest Airlines Co. (NYSE:LUV)
 Seasonal Chart")
KeyCorp (NYSE:KEY)
 Seasonal Chart")
Comerica (NYSE:CMA) Seasonal Chart
The Markets
Stocks jumped on Friday as investors covered negative bets ahead of the three-day long weekend in the US. The S&P 500 Index closed higher on the day by 1.34%, still not enough to recoup the pronounced losses accumulated throughout the week.The large-cap benchmark ended down for the week by 1.24%. Looking at the weekly chart, the S&P 500 Index is testing its 20-week moving average, a level that has supported the long-term trend over the past two years.
Major weekly moving averages, including the 20, 50, and 200-week, continue to point higher, suggesting a long-term positive trend. Weekly momentum indicators remain bullish, although negative divergences suggest upside exhaustion. A catalyst may be required to reinvigorate upside momentum. Seasonally, the market remains in this sluggish period as stocks gyrate through the fourth quarter earnings season.


Shares of energy companies led the equity market performance on Friday following a 5% rebound in the price of Oil. Investors are showing signs of nibbling away at beaten down energy names in hopes for quick gains that would potentially result from a rebound rally. The Energy Sector ETF (ARCA:XLE) is hinting of a short-term double bottom around $72, potentially bringing upon a pause of the longer-term trend of lower-highs and lower-lows.
The Energy Exploration and Production ETF (NYSE:XOP) and the iShares Canadian S&P/TSX Capped Energy Index Fund (TO:XEG) are showing similar short-term bottoming patterns. Positive momentum divergences on the charts of the sector ETFs suggest waning downside pressures as energy companies get set to report earnings. Halliburton and Baker Hughes will report today before the opening bell, providing further insight as to the impact of lower oil prices. Seasonally, the energy sector is entering the time frame when stocks start to trend higher, rebounding from a seasonal low that is typically realized in December/January. The positive pattern for the sector concludes closer to the end of spring as energy commodities peak ahead of the start of the summer season.


While markets in the US were closed for Martin Luther King day, the Shanghai Composite recorded steep losses as regulators charged top brokers with illegal activities in margin trading. The benchmark plunged 7.7%, falling below the the 20-day moving average for the first time since October.
The Shanghai Composite has charted a parabolic move higher since breaking above resistance around 2500 last November, quickly becoming significantly overbought and leaving the benchmark vulnerable to swift corrective declines, such as what occurred on Monday. The next level of variable support below the 20-day moving average can be found at the 50-day, currently at 2891. As long as the breakout above 2500 holds, a trend of higher-highs and higher-lows over the intermediate-term can be expected. The Shanghai equity benchmark remains seasonally strong through to May, outperforming benchmarks back here in North America.


Sentiment on Friday, as gauged by the put-call ratio, ended bullish at 0.91. The average true range of the ratio continues to trend higher, suggesting ongoing investor uncertainty, potentially leading to further equity market volatility.

Sectors and Industries entering their period of seasonal strength:


Seasonal charts of companies reporting earnings today:


S&P 500 Index


TSE Composite


Horizons Seasonal Rotation ETF (TO:HAC)
- Closing Market Value: $15.00 (unchanged)
- Closing NAV/Unit: $15.00 (down 0.25%)
Performance*
| 2015 Year-to-Date | Since Inception (Nov 19, 2009) | |
| HAC.TO | -0.86% | 50.0% |
* performance calculated on Closing NAV/Unit as provided by custodian

Disclaimer: Stocks highlighted are for information purposes only and should not be considered as advice to purchase or to sell mentioned securities. As always, the use of technical and fundamental analysis is encouraged in order to fine tune entry and exit points to average seasonal trends.