
**NEW** As part of the ongoing process to offer new and up-to-date information regarding seasonal and technical investing, we are adding a section to the daily reports that details the stocks that are entering their period of seasonal strength, based on average historical start dates.Stocks highlighted are for information purposes only and should not be considered as advice to purchase or to sell mentioned securities. As always, the use of technical and fundamental analysis is encouraged in order to fine tune entry and exit points to average seasonal trends.
Stocks Entering Period of Seasonal Strength Today:
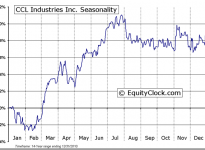
CCL Industries Inc. (TSE:CCL.B) Seasonal Chart
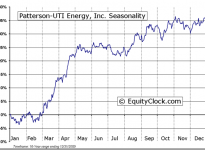
Patterson-UTI Energy, Inc. (NASDAQ:PTEN) Seasonal Chart
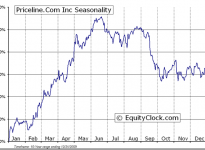
priceline.com Incorporated (NASDAQ:PCLN) Seasonal Chart
DVN) Corporation (NYSE:DVN) Seasonal Chart" src="https://d1-invdn-com.akamaized.net/content/pic12aacec9faaed2fcac5b3f8642ef99dc.png" height="443" width="609">
Devon Energy Corporation (NYSE:DVN) Seasonal Chart
The Markets
Stocks gained on Friday following the announcement of a ceasefire between Ukraine and Russia. The S&P 500 Index and Russell 2000 Index exceeded their December peaks to close at new all-time highs. Momentum indicators for the major equity benchmarks in the US continue to be bullish, suggesting that the early February low may have been an important one; The S&P 500 Index, Dow Jones Industrial Average, and Russell 2000 Index all tested support at their respective 200-day moving average lines as the month began, leading to the healthy bounce that has led to the present highs. Now that resistance at the previous peak has been broken, next level of significance on the upside for the S&P 500 Index can be found at 2150, representing trendline resistance that has restrained trading activity for over a year.

Looking at the near-term seasonal tendencies, the last half of February has historically been fairly negative for stocks. Over the last 20 years, the S&P 500 Index has fallen by an average of 1.15% between February 16th and March 2nd. The large cap index has ended lower in 65% of those seasonally weak periods. This period typically follows the monthly options expiration date, an event that has the tendency to act as a pivot point to the prevailing market trend. The next seasonal up-leg for stocks, the trend that lifts all boats, runs from the start of March through to the start of May as investors react to first quarter earning reports.
Thanks to all those that called into Friday’s edition of BNN’s Market Call Tonight. Below is an excerpt of my Market Outlook, as publish at TheGlobeAndMail.com. To read more about my top picks and to review my past picks, please visit the BNN Market Call article at the Globe Investor.
Stocks have had a lacklustre start to 2015, consolidating following fairly healthy gains accumulated last year. The S&P 500 index has traded within an 80-point range that topped out around 2,064 as investors remained cautious given the overhanging macroeconomic issues. Defensive assets, such as bonds and high yielding equities, were the beneficiaries of the market uncertainty through the month of January, but the risk-off trend is showing signs of changing. Following another strong employment report for the month of January, treasury yields in the U.S. traded firmly higher, forcing investors out of some of those higher yielding equities in the utilities and REIT sectors. Consumer staples and health care, two defensive sectors, have also started to show performance that is lagging that of the broad market as investors rotate towards materials, financials, and consumer discretionary. This cyclical rotation is typically a positive for the broad equity market as investors venture out on the risk spectrum.
Seasonally, cyclical sectors, including industrials, materials, energy, financials and consumer discretionary tend to perform well into the spring, benefiting from the uptick in economic activity following the winter months. This risk-on sentiment amongst equity investors tends to result in gains for the S&P 500 index, particularly during the months of March and April. Between March 1 and May 5, the large-cap benchmark has recorded gains 75 per cent of the time over the past 20 years, resulting in an average gain of 4.23 per cent. Assuming markets can get past some of the overhanging macroeconomic concerns, there is a strong probability for further gains in stock prices during the months ahead.
Sentiment on Friday, as gauged by the put-call ratio, ended close to neutral at 0.97.

Seasonal charts of companies reporting earnings today:


S&P 500 Index


TSE Composite


Horizons Seasonal Rotation ETF (TSX:HAC)
- Closing Market Value: $16.11 (up 0.50%)
- Closing NAV/Unit: $16.08 (up 0.51%)
Performance*
| 2015 Year-to-Date | Since Inception (Nov 19, 2009) | |
| HAC.TO | 6.28% | 60.8% |
