Upcoming US Events for Today:
- Weekly Crude Inventories will be released at 10:30am.
Upcoming International Events for Today:
- Bank of England Minutes will be released at 4:30am EST.
- Canadian Retail Sales for May will be released at 8:30am EST. The market expects a month-over-month increase of 0.5% versus an increase of 1.1% previous.
- Euro-Zone Flash Consumer Confidence for July will be released at 10:00am EST. The market expects –7.4, consistent with the previous report.
- Japan Merchandise Trade for June will be released at 7:50pm EST. The market expects a deficit of ¥688B versus a deficit of ¥909.0B previous.
- Japan Flash Manufacturing PMI for July will be released at 9:35pm EST. The market expects 51.9 versus 51.1 previous.
- China Flash Manufacturing PMI for July will be released at 9:45pm EST. The market expects 51.2 versus 50.8 previous.
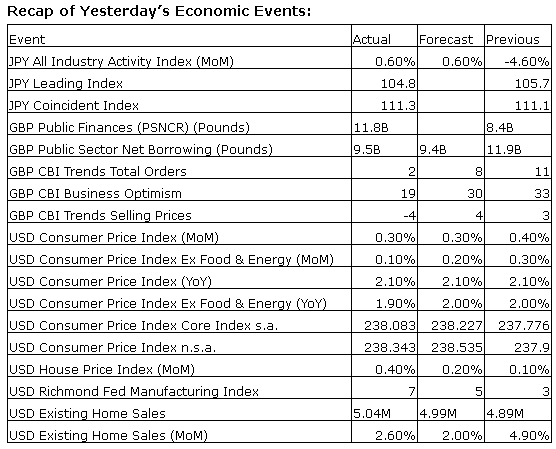
The Markets
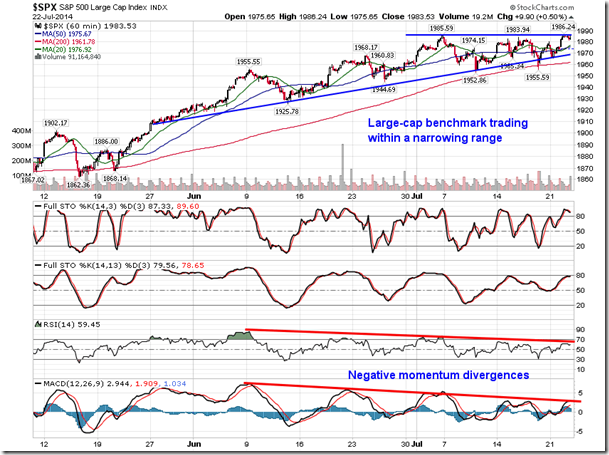
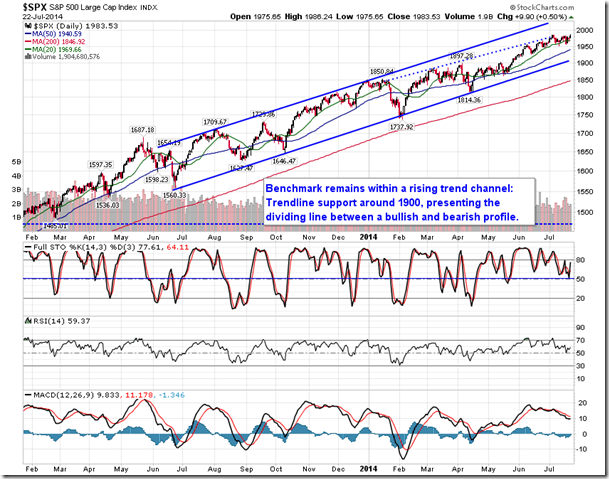
Stocks pushed higher on Tuesday as investors continue to brush off international concerns and instead focus on strong earnings and economic data in the US. The S&P 500 Index briefly charted a new all-time intraday high, however, resistance around 1985 remained very much intact, preventing the benchmark from advancing beyond the half of a percent return on the day. The hourly chart of the large-cap index continues to show a narrowing trading range, from which a breakout appears imminent. The pattern resembles that of an ascending triangle, typically a continuation pattern, which could suggest an upside move beyond resistance. Negative momentum divergences with respect to MACD and RSI have become apparent as stocks struggle to close above the early July peak.
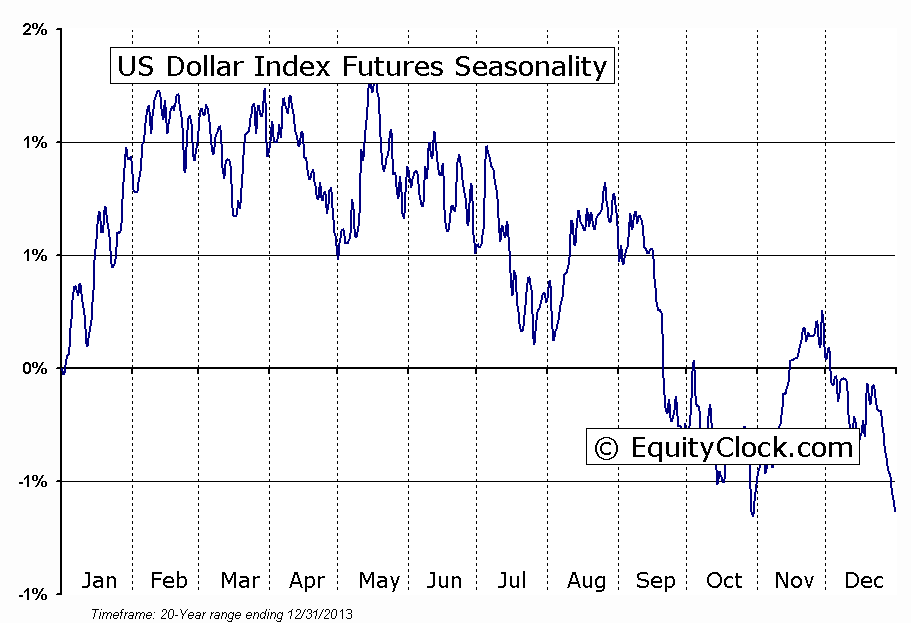
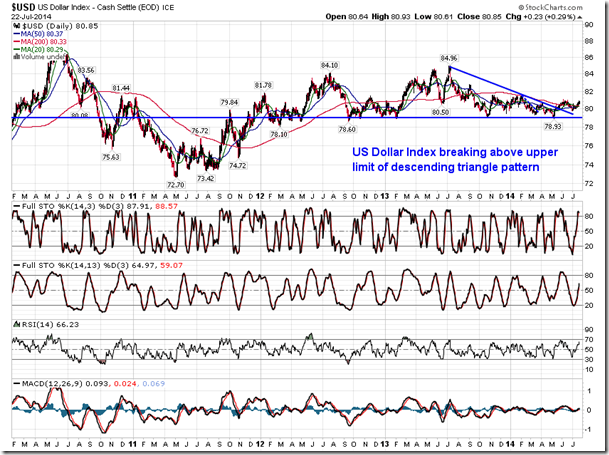
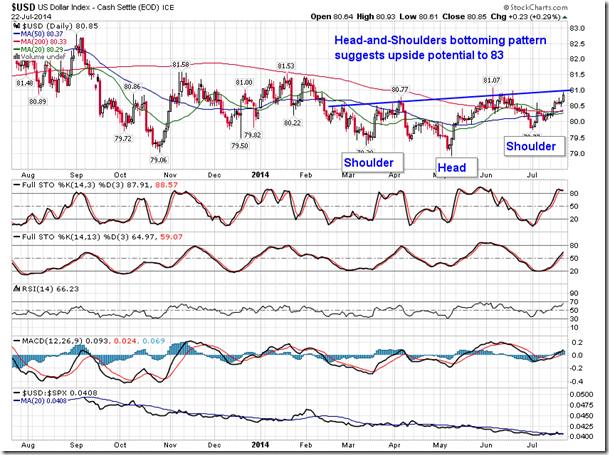
One potential headwind for the equity market is the emerging strength in the US Dollar Index. The US Dollar Index broke above declining trendline resistance back in May and is now testing resistance at the June high of 81. The currency benchmark has charted what appears to be a head-and-shoulders bottoming pattern, which implies upside potential all the way to 83 should the neckline around 81 be broken. Strength in the US currency often acts as a negative influence on equity and commodity prices valued in the domestic currency as the cost to purchase becomes more expensive to outsiders. Seasonally, the US dollar typically declines through to October, however, anticipation of a rate increase by the Fed and weakness in the Euro has supported the US currency in recent weeks.
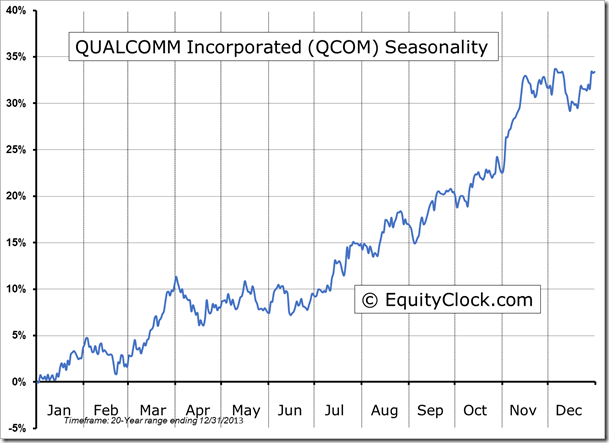
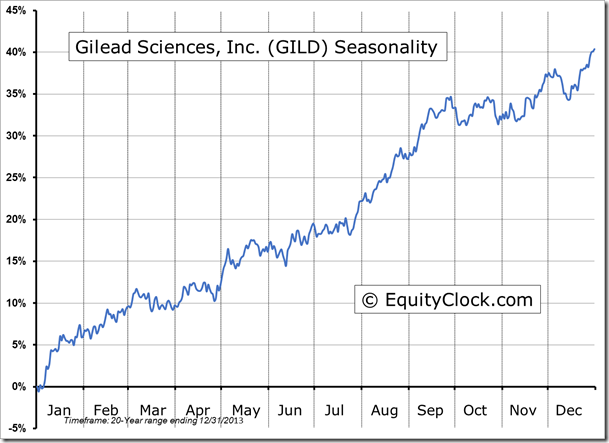
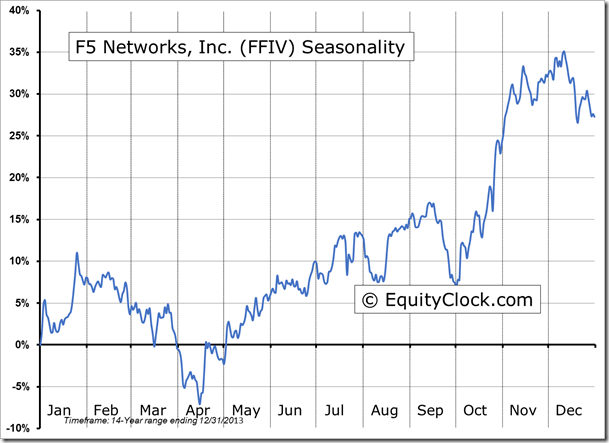
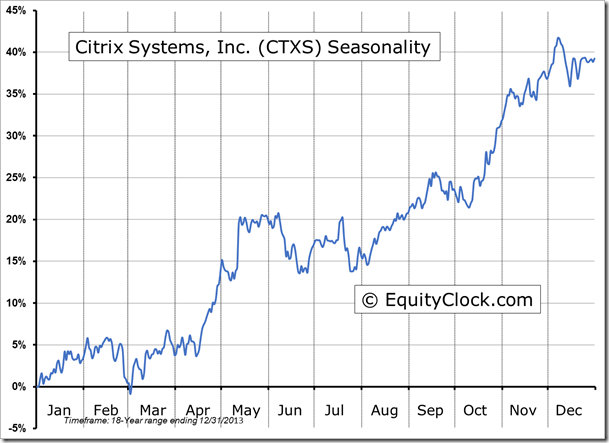
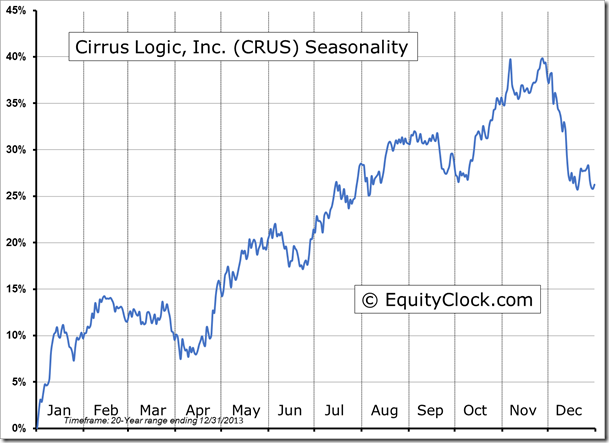
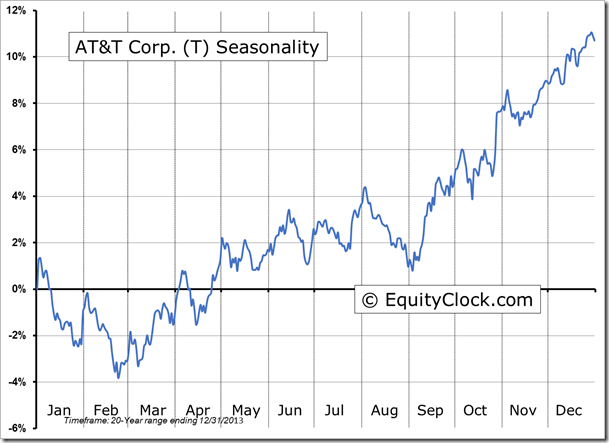
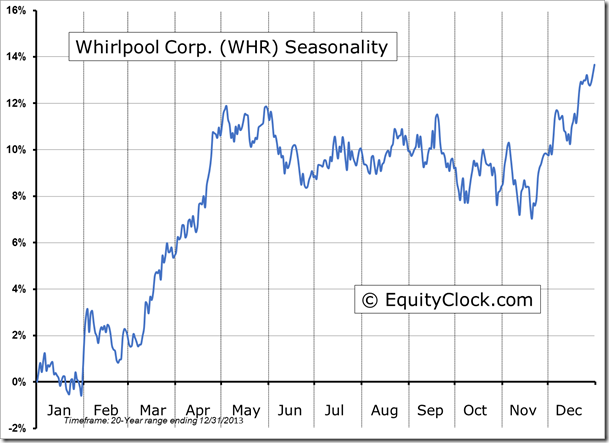
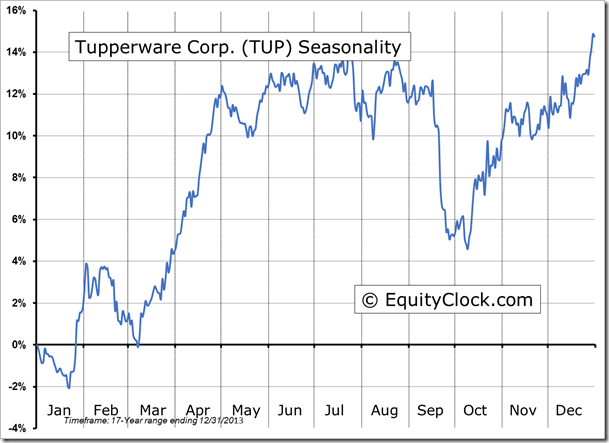
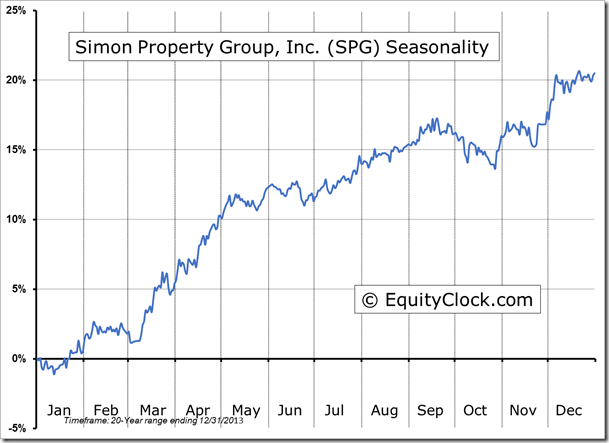
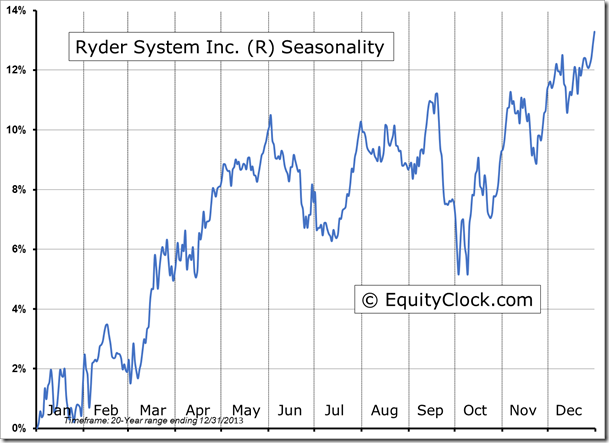
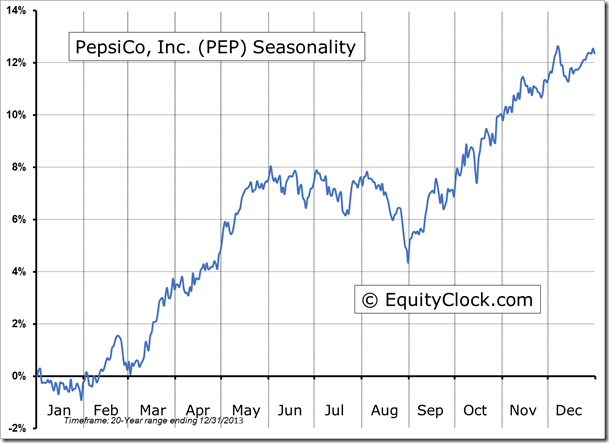
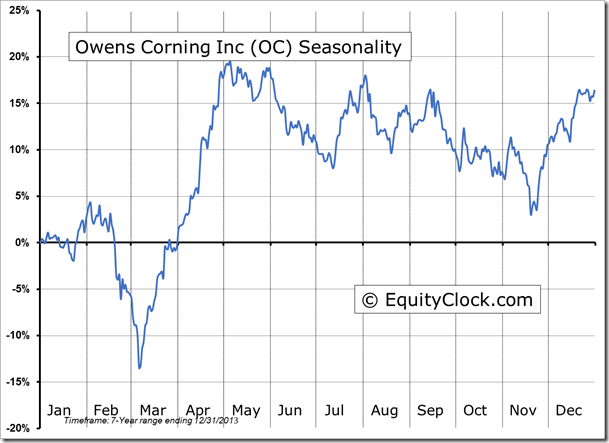
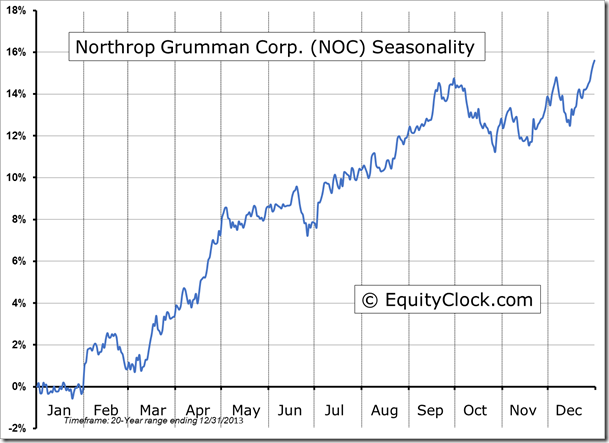
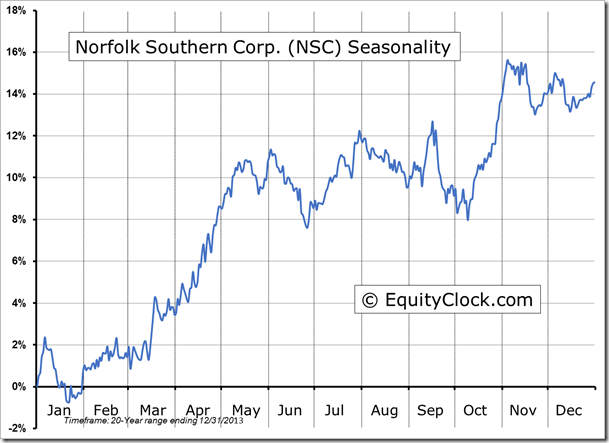
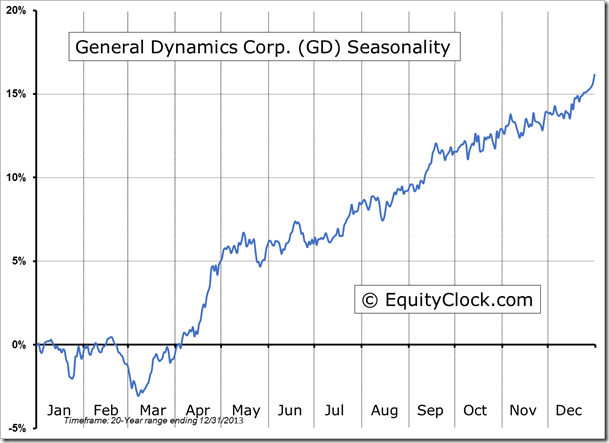
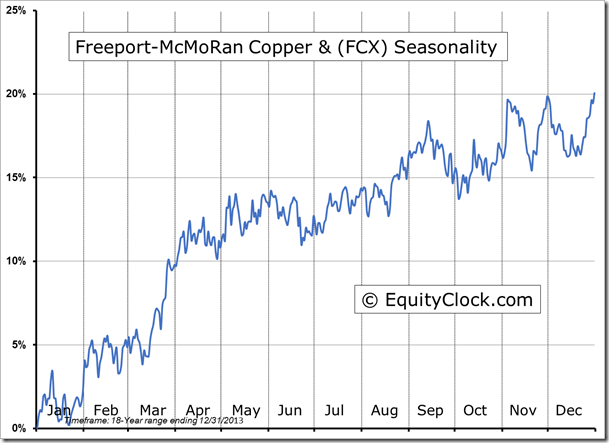
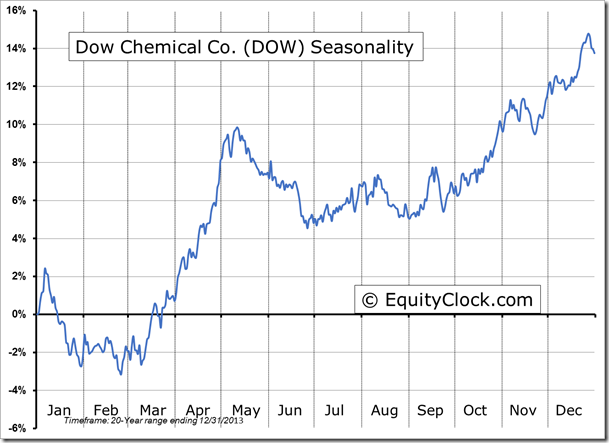
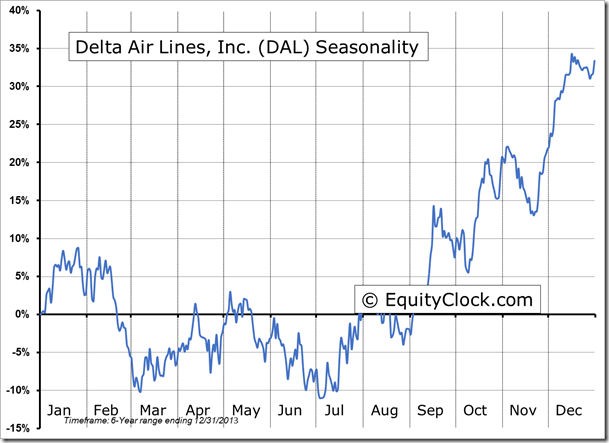
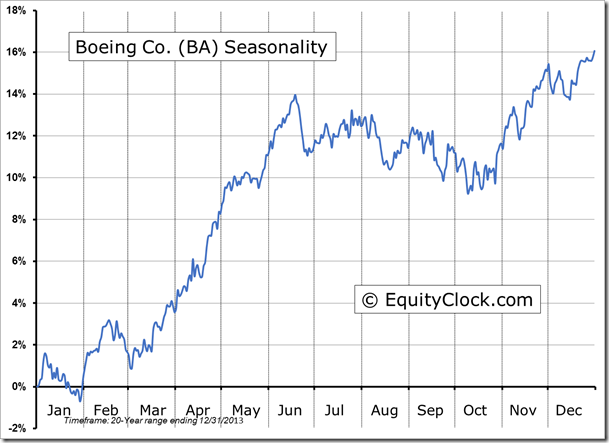
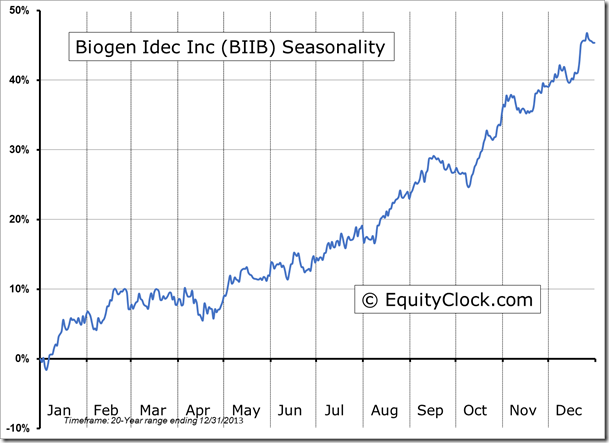
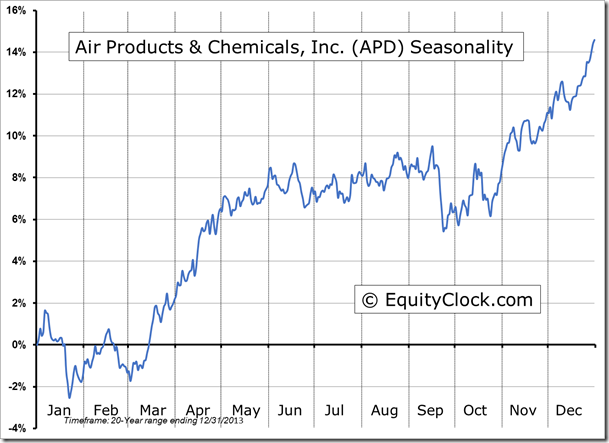
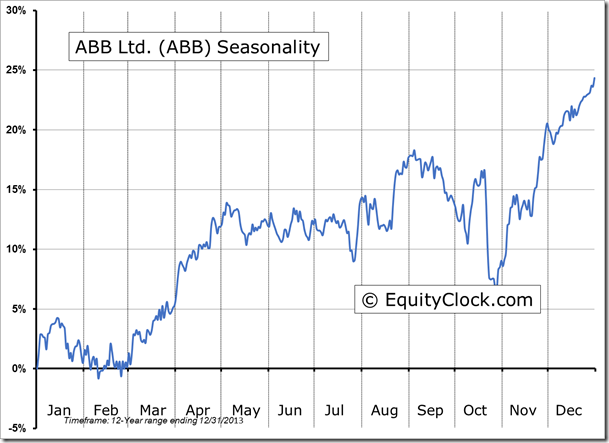
Seasonal charts of companies reporting earnings today:
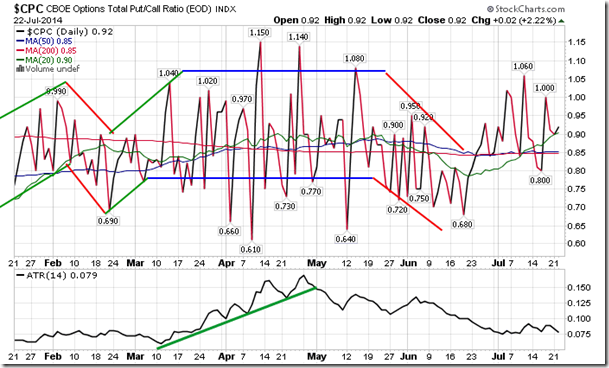
Sentiment on Tuesday, as gauged by the put-call ratio, ended bullish at 0.92.
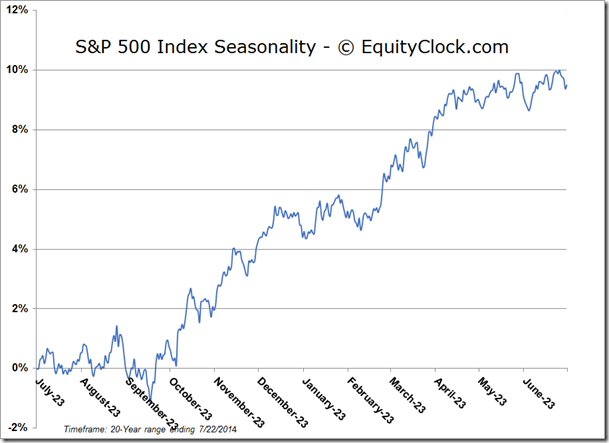
S&P 500 Index
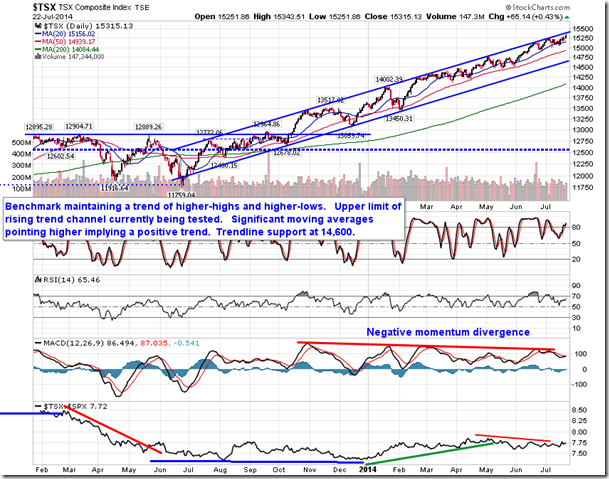
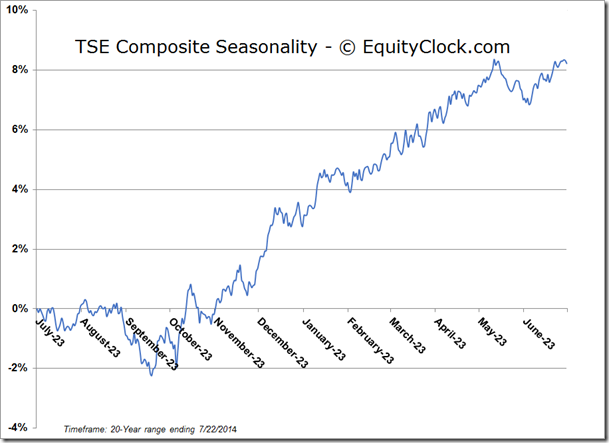
TSE Composite
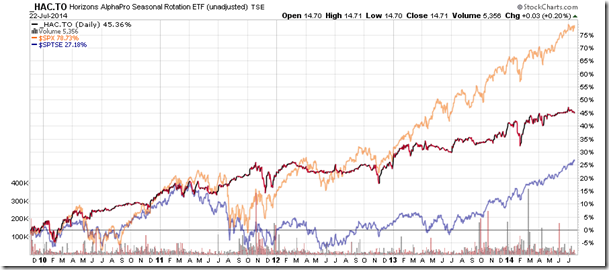
Horizons Seasonal Rotation ETF (TO:HAC)
- Closing Market Value: $14.71 (up 0.20%)
- Closing NAV/Unit: $14.69 (down 0.13%)
Performance*
| 2014 Year-to-Date | Since Inception (Nov 19, 2009) | |
| HAC.TO | 2.73% | 46.9% |
* performance calculated on Closing NAV/Unit as provided by custodian
