Get 40% Off
🚨 Volatile Markets? Find Hidden Gems for Serious OutperformanceFind Stocks Now

Market Has 3rd Straight Weekly Gain

Published 10/18/2015, 02:15 AM
Updated 07/09/2023, 06:31 AM

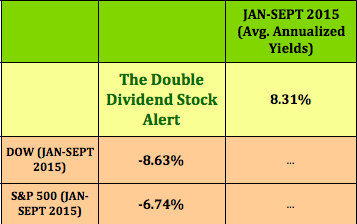
Dow and S&P 500 Chart

Markets: The market had its 3rd straight weekly gain this week. 3 out of 4 indexes had respectable rallies this week, with the NASDAQ leading the way. Healthcare bounced back this week, and Utilities led the way, as mixed to weaker data gave investors a stronger bias toward the Fed not raising rates until 2016.
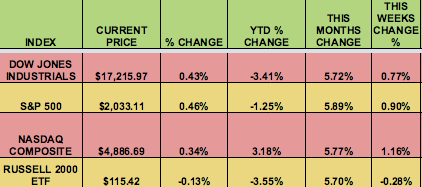
Indices Chart

Volatility:
The VIX dropped 12%, to end the week at $15.05, its latest close since August 18th.

Currency: The dollar fell vs. most major currencies, with rate hike expectations pushed further out. Many commodity-driven nations are selling US debt. Due to falling commodity prices, they don’t have the cash to park in US Treasuries like they formerly did.
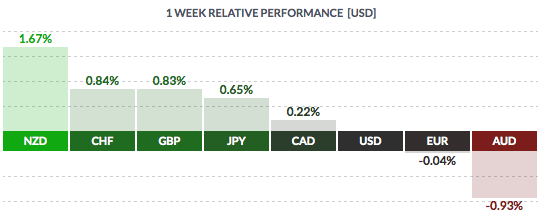
USD 1 Week Relative Performance

Market Breadth: 21 of the DOW 30 stocks rose this week, vs. 29 last week. 58% of the S&P 500 rose this week, vs. 88% last week.

US Economic News: The Initial Unemployment Claims average dipped to its lowest since 1973. Continuing Claims hit its lowest in 15 years. Sept. Retail Sales missed forecasts. Inflation remains tame, with the PPI and the CPI both falling. Consumer Sentiment jumped, beating expectations, and regaining what it lost in Sept. Home purchase apps fell 34%.
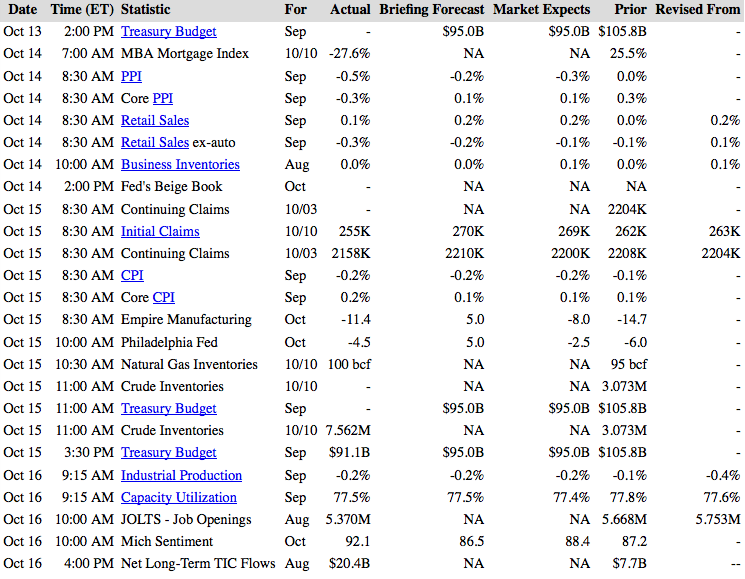
Economic Events

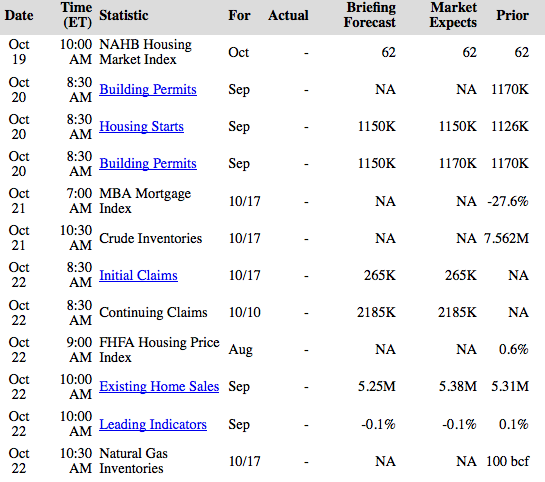
Week Ahead Highlights: The Housing Industry will be in the spotlight net week, with several reports due out. There will also be a focus on Tech earnings, with several large Tech firms reporting, such as Microsoft (O:MSFT), IBM (N:IBM), and Yahoo (O:YHOO). 12 of the 30 DOW stocks will report, and over 20% of the S&P 500 will report as well.

3rd party Ad. Not an offer or recommendation by Investing.com. See disclosure here or remove ads .

Next Week’s US Economic Reports:
Next Week's Economic Reports

Sectors and Futures:
Utilities led this week,with rate hike fears subsiding, as Industrials trailed, reacting to weak US data.
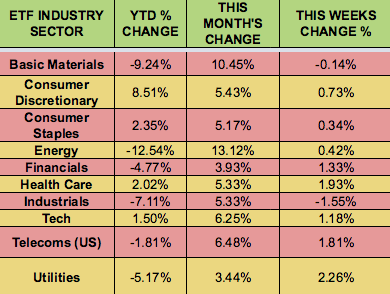
Sectors Chart

OJ led this week, with Rough Rice trailing:
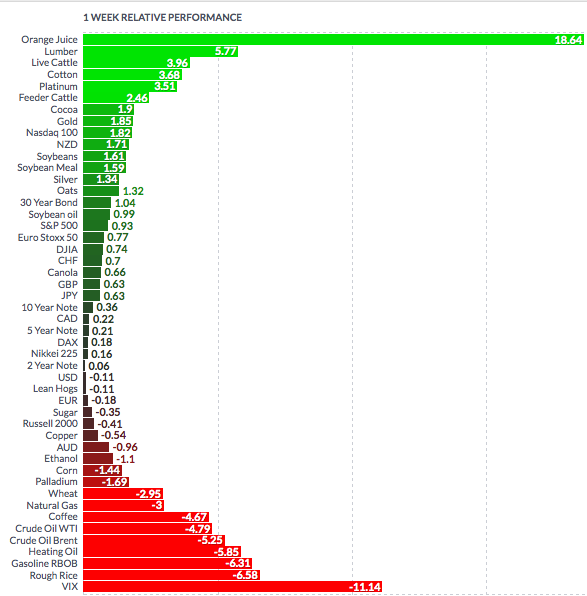
Commodities Chart

Latest comments

Risk Disclosure: Trading in financial instruments and/or cryptocurrencies involves high risks including the risk of losing some, or all, of your investment amount, and may not be suitable for all investors. Prices of cryptocurrencies are extremely volatile and may be affected by external factors such as financial, regulatory or political events. Trading on margin increases the financial risks.
Before deciding to trade in financial instrument or cryptocurrencies you should be fully informed of the risks and costs associated with trading the financial markets, carefully consider your investment objectives, level of experience, and risk appetite, and seek professional advice where needed.
Fusion Media would like to remind you that the data contained in this website is not necessarily real-time nor accurate. The data and prices on the website are not necessarily provided by any market or exchange, but may be provided by market makers, and so prices may not be accurate and may differ from the actual price at any given market, meaning prices are indicative and not appropriate for trading purposes. Fusion Media and any provider of the data contained in this website will not accept liability for any loss or damage as a result of your trading, or your reliance on the information contained within this website.
It is prohibited to use, store, reproduce, display, modify, transmit or distribute the data contained in this website without the explicit prior written permission of Fusion Media and/or the data provider. All intellectual property rights are reserved by the providers and/or the exchange providing the data contained in this website.
Fusion Media may be compensated by the advertisers that appear on the website, based on your interaction with the advertisements or advertisers.
© 2007-2024 - Fusion Media Limited. All Rights Reserved.