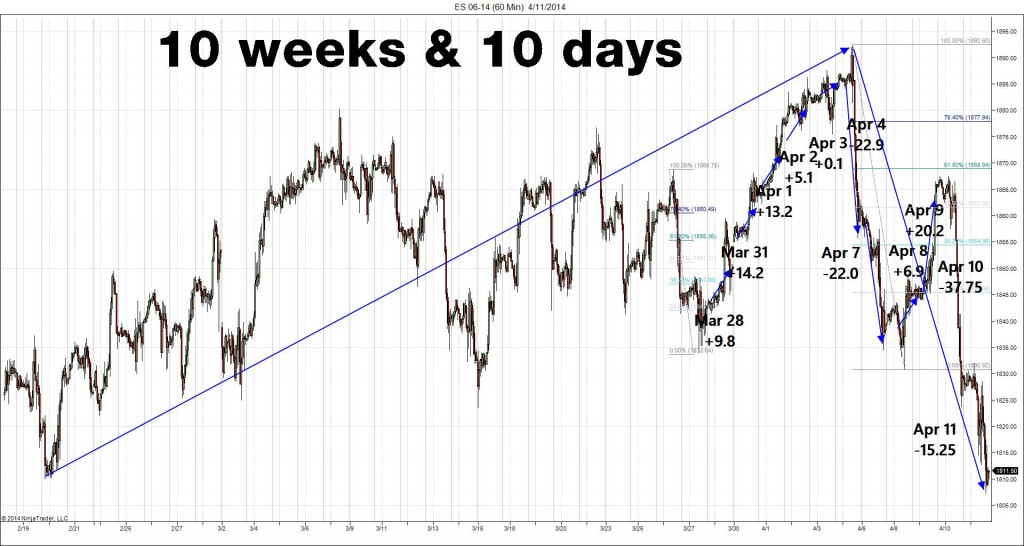
The Dow Jones Industrial Average is -2.6% in April and the S&P is down -3%. And it happened in less time than it takes the milk in your fridge to expire.

Despite the recent downdraft, U.S.-based investors put $8.9 billion into U.S. mutual and exchange-traded (stock and equity) funds in the week ending April 9, the largest inflows in a month. At the same time bond funds reported outflows.
Since 7:00 Sunday night the S&P 500 futures [SPM14] has traded a 10-handle range between 1803 and 1813. The way the S&P went out on Friday, we suspected the S&P would continue down. There are a lot of sell stops that start under 1801.70 all the way down to 1786.00. Below that is the 200-day moving average at 1760.00.
And for those looking at the big picture, it has been 651 days since the last 10% correction. A 10% correction from the recent 1892.50 high in the E-mini [CME:ESM14] would put the market around 1710.
The Asian markets closed mostly lower and 12 out of 12 European markets are down. Today’s economic calendar includes 20 separate economic releases, 10 T-bill or T-bond announcements or auction and earnings from Goldman Sachs Group Inc (NYSE:GS), Johnson & Johnson (NYSE:JNJ), General Electric Company (NYSE:GE), Google Inc. (NASDAQ:GOOGL) and International Business Machines (NYSE:IBM) . Today’s economic calendar starts out the week with retail sales and business inventories.
Our view

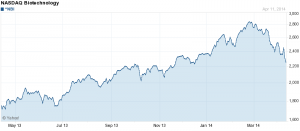
There seems to be a sea-change going on in the S&P. We all know the liquidation in the Nasdaq biotech sector has been weighing down on the markets, but the (NASDAQ Biotechnology) fell for the 7th straight week and is down -21% from its record closing high on Feb. 25.
On one side of the coin I want to see the S&P fall apart, but I also understand what happens after the S&P sells off sharply. That’s what makes it hard to be overly bearish in the S&P.
Let’s face it, the S&P is long overdue for a correction and I have always felt that it could come at any time, but like I said above, it’s not “Sell in May” anymore. The same way climate change has made certain flowers and trees bloom early, it’s now “Sell in April.” And more and more, no one is walking away. School’s not out for summer.
According to the Stock Trader’s Almanac, the Monday before the April expiration has the Dow up 17 of the last 25 “but” down 5 of the last 9. We also shouldn’t forget that April 15 is the tax filing deadline. Usually not a happy time.
However, happy or not, April 15, tax deadline day, is generally bullish: the Dow has been down only 6 times since 1981 and that falls right in line with MrTopStep’s Turnaround Tuesday, which has been up 13 out of the last 15 Tuesdays. The expiration study can give you further insight on historical tendencies.
With so many factors in play, it’s best not to go in with a strong directional bias about where the market “should” go. Watch for the trends, don’t try to catch falling knives or pick the tops. Keep an eye on the Nasdaq, which is leading the other stock indices. And as we always say, keep an eye on the 10-handle rule and please use stops when trading futures and options.
- In Asia, 7 of 11 markets closed lower: Shanghai Comp. +0.05%, Hang Seng +0.15%, Nikkei -0.36%
- In Europe, 12 of 12 markets are trading lower: DAX -0.14%, FTSE -1.35% at 7:05AM CT
- Morning headline: “S&P 500 futures seen lower ahead of Citigroup earnings”
- S&P fair value: 1809.29 (futures 12.21 higher at 1821.5 as of 7:34AM CT)
- Total volume: 2.52M ESM and 7.6K SPM traded
- Economic calendar: Retail sales and business inventories.
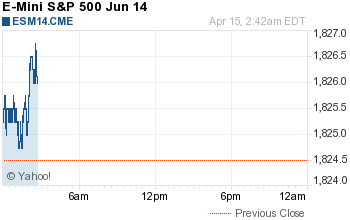
- E-mini S&P 5001826.75+2.25 - +0.12%
- Crude103.34-0.71 - -0.68%
- Shanghai Composite0.00N/A - N/A
- Hang Seng22731.881-306.92 - -1.33%
- Nikkei 22513996.81+86.649 - +0.62%
- DAX9339.17+23.88 - +0.26%
- FTSE 1006583.76+22.06 - +0.34%
- Euro1.3816

