Summary: It’s time for another look at the US economy. Economists have lots of enthusiasm. Lots of bad news, blamed on the severe winter that hit much (but not all) of America. It’s Spring. Has the data warmed up? Is it Springtime in America?
Content
- Stand by for the boom!
- About housing, a driver of the recovery
- The Architecture Billings Index
- Chicago Fed’s National Activity Index
- World trade volume
- For More Information
(1) Stand by for the boom!
Every year since the crash economists forecast decent growth next year (2% – 2.5%) and ~3% growth in 3 years. But late last year economists varied the script: they forecast 3.1% growth in 2015 and 2016 — but also strong growth next year. They forecast that the US economy would accelerate to escape velocity. They cheered for the “Red, White, and Boom”. See the Fed’s Survey of Professional Forecasters, 14 February 2014:
- 2014: Q1…2.0%
- 2014: Q2…3.0%
- 2014: Q3…2.8%
- 2014: Q4…2.7%
- 2013:…1.9%
- 2014:…2.8%
- 2015:…3.1%
- 2016:…3.1%
It’s April. How’s that 2014 boom running? Although estimates for Q1 have fallen from 2.5% in December to 2% now, but hope remains for faster growth in the rest of the year. Previously we looked at the strong automobile sales, fueled by easy credit to increasingly sub-prime households. This looks to run for a while longer. Here we examine some other economic indicators.
The economy is complex beyond understanding. These are just snips, clues to the future.
(2) About housing, a driver of the recovery
The housing sector is expected to be another driver of the recovery. So far the omens look bad, but economists and housing experts remain confident. They’ll remain so until prices rollover, which they eventually will if these trends continue.
The weakness of housing activity has lasted since summer, and its broad geographically. This shows that it does not result from bad weather alone. Let’s review the ugly numbers.
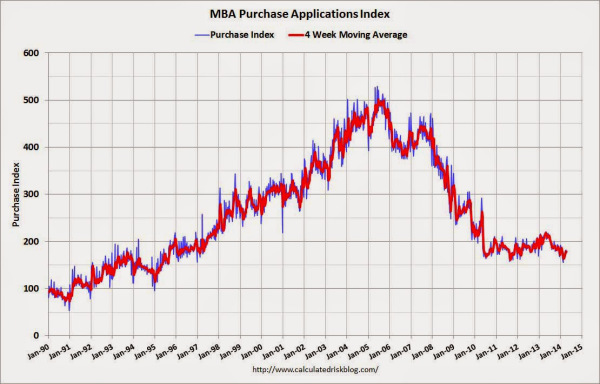
(a) Purchase mortgage applications for week ending April 18: -18% YoY NSA, continuing their year-long decline.
(b) February pending home sales (recorded at contract signing):
- -00.8% MoM (West +2.3%)
- -10.5% YoY (West -16%)
- -15.3% since June 2013 peak
- 8th consecutive decline
- Lowest since October 2011
(c) March New home sales (recorded at contract signing):
- -14.5% MoM SA (West -17%)
- -01.8% YTD YoY NSA (West -25%)
- -12.2% YoY NSA (West -27%)
- -18.3% SA from the cycle peak in January 2014
- Inventory in terms of months supply SA 6.0 from 4.8 in January, from 4.2 in March 2013
(d) March existing home sales (recorded at contract closing, 4 – 8 weeks after signing the contract):
- -00.2% MoM SA (West -3.7%)
- -07.5% YoY (West -13.4)
- -14.7% since June 2013
- Lowest since July 2012
- Months supply up 5.2 from cycle low 4.3 in January, from 4.7 in March 2013 (leading indicator of prices)
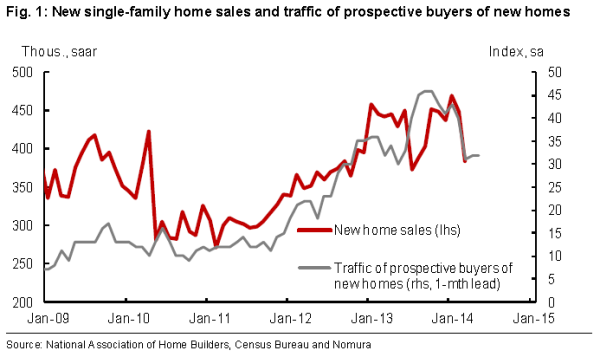
(e) Another leading indicator of prices, the index measuring traffic of new prospective new home buyers:
- 32 in April, down 30% from the August and September peak of 46
- Up 7% YoY
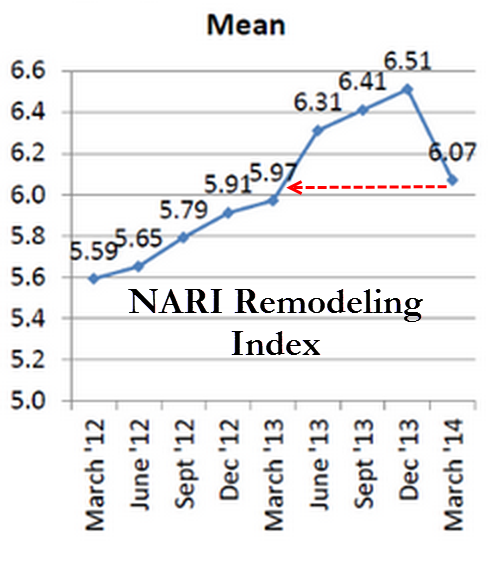
(f) The Q1 Home Remodeling Index (often considered a leading indicator, but we have only Q1 data)
(3) Looking more broadly at construction: the Architecture Billings Index
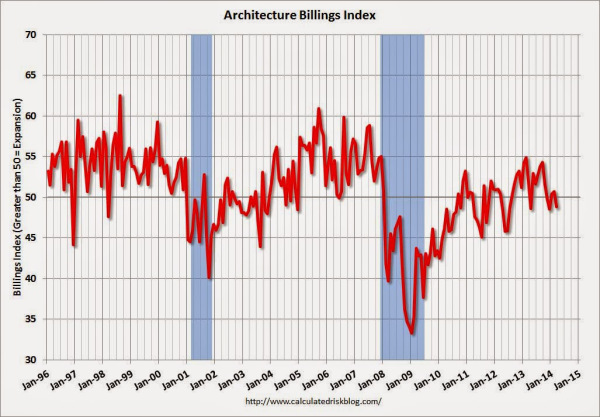
A broader perspective gives no more cheer. The Architecture Billings Index of the American Institute of Architects for March was 48.8, near its lows running back to Fall 2012. Below 50 means a decrease in billings. The AIA says “the ABI reflects the approximate 9 to 12 month lead time between architecture billings and construction spending.”
(4) Chicago Fed National Activity Index
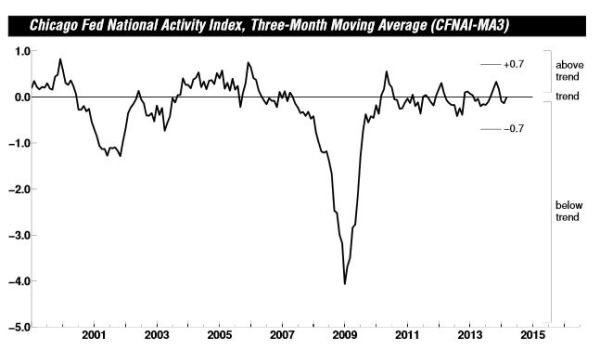
For an even broader perspective see The National Activity Index of the Chicago Federal Reserve. Zero means growth at the average trend. March was down 70% from the November peak, which was the high going back to December 2006.
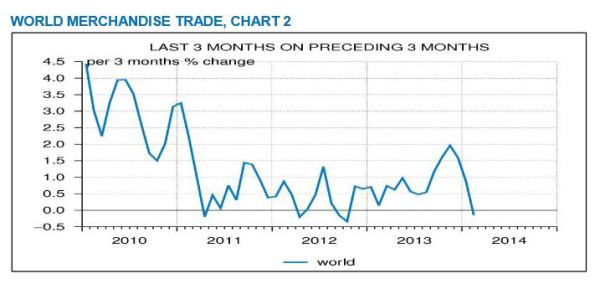
For an ever wider perspective let’s look at the bloodstream of the global economy: the volume of world merchandise trade, tracked by the CPB Netherlands Bureau for Economic Policy Analysis. In February their indicator of trade momentum turned negative for first time since October 2012, reflecting a large slowdown during the last few months.
(6) For More Information
An excellent report about the housing cycle from a top analyst: “Why we could be back in a housing bubble right now“, Mark Hanson, 11 March 2014
About the economy:
- Rising consumer debt driving the recovery: boon or bane?, 10 November 2013
- What can we expect from the US economy in 2014?, 21 February 2014
- Auto loans are a driver of the expansion, but might be running out of gas, 1 April 2014

