
Lower costs driven by a successful expense savings initiative led State Street Corporation’s (NYSE:STT) second-quarter 2016 operating earnings of $1.46 per share, which handily surpassed the Zacks Consensus Estimate of $1.26. Also, the reported figure was up 7.4% year over year.
Better-than-expected results were driven by lower expense base and improved processing fees and other revenue. These were partly offset by a decline in net interest revenue, trading services revenue, management fees and servicing fees. A strengthening U.S. dollar and the challenging market environment adversely impacted operating revenues. Also, growth in assets remained under strain.
After considering certain non-recurring items, net income available to common shareholders came in at $585 million or $1.47 per share, up from $389 million or 93 cents per share in the year-ago quarter.
Revenues Decrease, Expenses Support Results
Revenues, on a GAAP basis, totaled $2.57 billion, down 1.3% year over year. Further, the top line came in lower than the Zacks Consensus Estimate of $2.66 billion.
Net interest revenue, on an operating basis, inched down 1.8% from the year-ago quarter to $546 million. The decline was mainly due to the success in reducing the size of the balance sheet in 2015, partially offset by higher U.S. market interest rates and disciplined liability pricing.
However, net interest margin increased 15 basis points year over year to 1.11%.
Fee revenues came in at $2.13 billion, down 2% from the prior-year quarter. All components of fee income showed weakness except securities finance revenue as well as processing fees and other revenue.
On an operating basis, non-interest expenses were $1.83 billion, down 2.8% on a year-over-year basis. Increase in compensation and employee benefits costs, information systems and communications expenses and transaction processing services costs was more than offset by lower other expenses.
As of Jun 30, 2016, total assets under custody and administration were $27.8 trillion, down 3% year over year. Moreover, assets under management were $2.3 trillion, down 3.1% year over year.
Capital and Profitability Ratios Improve
Under Basel III (Advanced approach), the estimated Tier 1 common ratio was 12.0% as of Jun 30, 2016.
Return on common equity (on an operating basis) came in at 12.3% compared with 11.9% in the year-ago quarter.
Share Repurchases
During the reported quarter, State Street repurchased shares worth $390 million at an average price of $59.66 per share. This was part of the company’s buyback plan, which authorized the purchase of up to $1.8 billion of stock through the second quarter of 2016.
Further, the company approved a $1.4 billion share buyback program following the Federal Reserve's review of its capital plan.
Our Viewpoint
We expect State Street’s restructuring programs, along with stable core servicing and investment management franchises, to help offset its top-line weakness. However, a low interest rate environment and a persistent fall in net interest revenue are expected to remain a drag on the company’s top line in the quarters ahead.
STATE ST CORP Price, Consensus and EPS Surprise
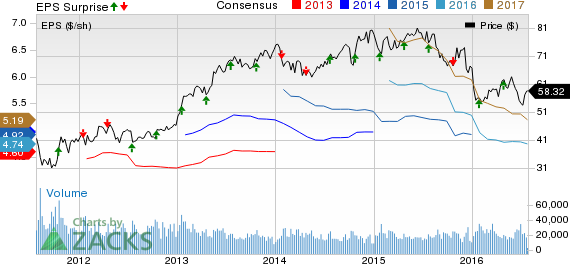
STATE ST CORP Price, Consensus and EPS Surprise | STATE ST CORP Quote
Currently, State Street carries a Zacks Rank #3 (Hold).
Performance of Other Major Regional Banks
BB&T Corporation’s (NYSE:BBT) second-quarter 2016 adjusted earnings beat the Zacks Consensus Estimate. An improved net interest income and non-interest income led to the better-than-expected results. However, higher operating expenses and a rise in provision for credit losses were the headwinds.
The Bank of New York Mellon Corp. (NYSE:BK) reported second-quarter 2016 adjusted earnings per share which outpaced the Zacks Consensus Estimate. Better-than-expected results were driven by lower expenses and benefit from provisions, partly offset by a slight fall in revenues.
Higher expenses and provisions led KeyCorp.’s (NYSE:KEY) second-quarter 2016 adjusted earnings from continuing operations to miss the Zacks Consensus Estimate. An increase in net interest income acted as a tailwind.
BB&T CORP (BBT): Free Stock Analysis Report
KEYCORP NEW (KEY): Free Stock Analysis Report
BANK OF NY MELL (BK): Free Stock Analysis Report
STATE ST CORP (STT): Free Stock Analysis Report
Original post
Zacks Investment Research