- Monitoring purposes SPX: Sold on 10/5/15 at 1987.05; gain 2.28%. long SPX on 9/22/15 at 1942.74.
- Monitoring purposes Gold: Flat
- Long-Term Trend monitor purposes: Flat

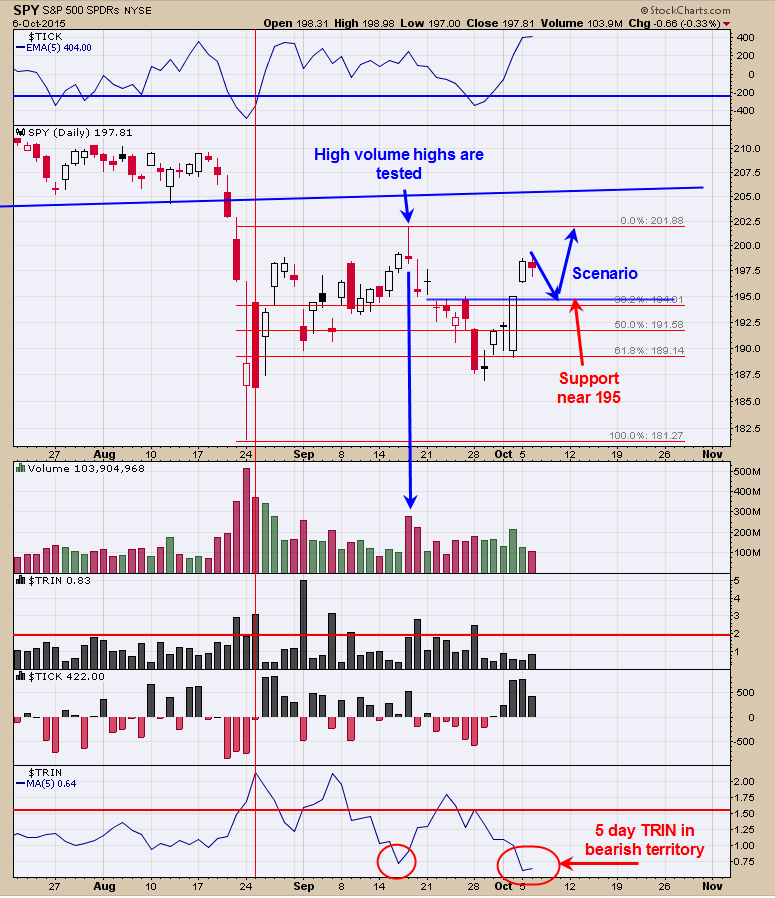
Today the SPY hit a minor new high and volume dropped more than 10% and closed lower suggesting a short-term pull back is about to start. There is good support near the 195 range and a place to watch for a bullish setup. We are still expecting a rally to test the 9/17 high near 202 on the SPY has that day had high volume and most high volume days are tested. The bottom window is the 5 day average of the TRIN and readings below .80 are considered short term bearish. The 5-day average of the TRIN closed today at .64. This is the week before option expiration week and a week where whipsaws are common. Option expiration week normally has a bullish bias and therefore we will be looking for a bullish setup on this potential pull back.

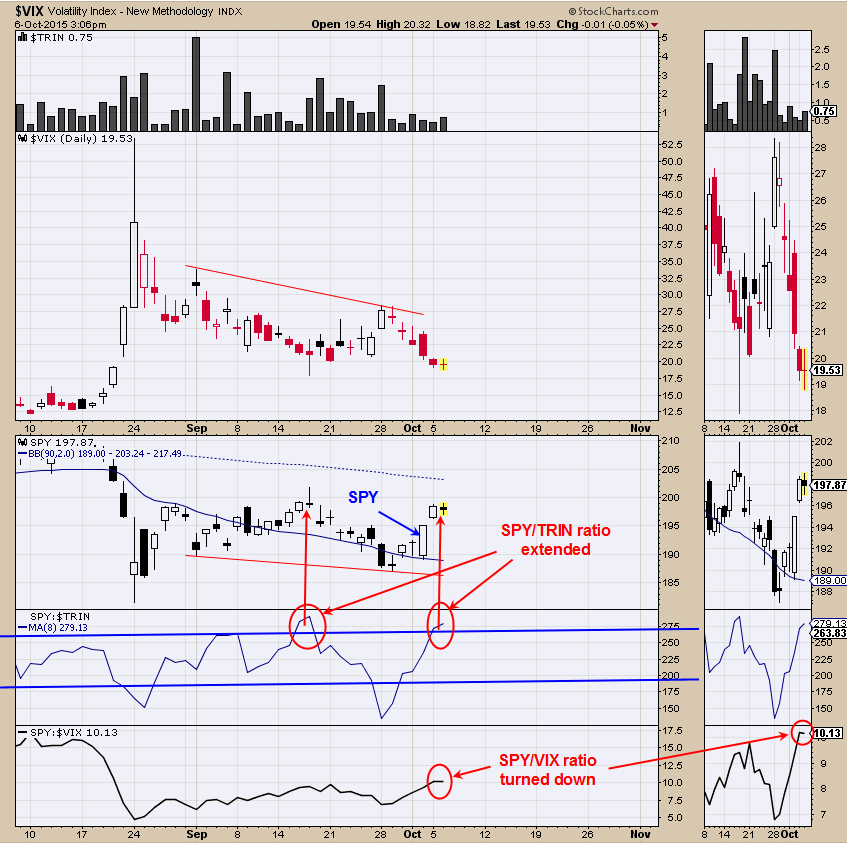
We are just looking for a consolidation this weeks that could take the SPY down into an support area near 195. The bottom window is the SPY/VIX ratio. When this ratio is trending up than market is in an uptrend and vice versa. When this ratio divergences against the SPY than the VIX did not confirm the last move to a new high (or new low) and a short term warning sign. This ratio turned down today and a short term divergences. Next window up is the SPY/TRIN ratio. When this ratio gets above the upper boundary line than that condition suggests the market is extended to the upside and is due for a rest. Its also worth remember that Friday and Monday’s TRIN readings where less than .60 and the TICK where greater than +500 showing short term exhaustion. A pull back to the 195 range on the SPY is possible short term.
Sold long SPX on 10/5/15 at 1987.05 = gain of 2.28%; Long SPX on the close of 9/22/15 at 1942.74.

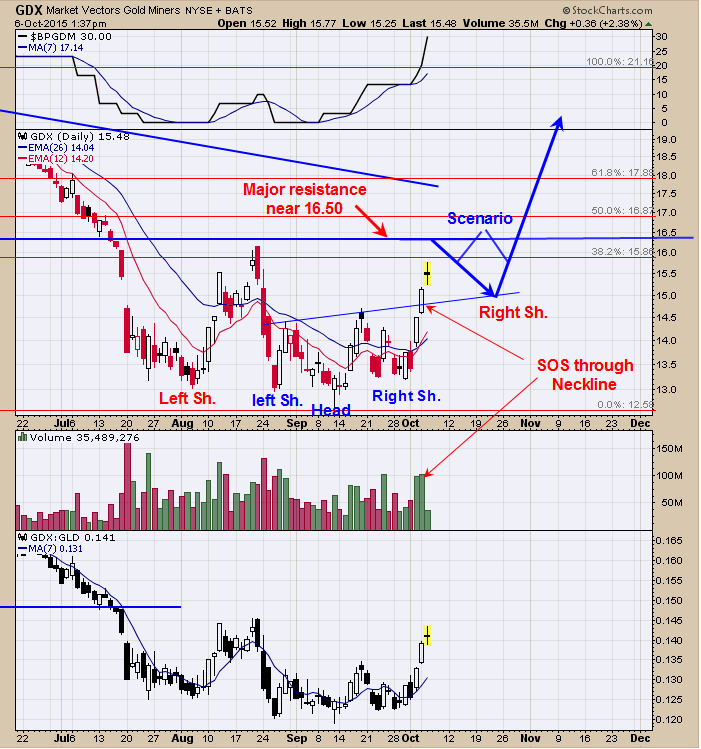
The COT (Commitment of Traders) report are neutral as the Small Speculator remains net short of last report dated 10/2/15 at -3,502 contract and Commercials are back to a neutral position with -73,143 contracts (below 50,000 contract is a bullish sign). The chart above is the daily Market Vectors Gold Miners (NYSE:GDX) going back to mid May. We have seen this pattern before and if it plays out like most of the others, than the bottom is already in at the September 11 low. The September 11 low was the Head of a Head and Shoulders bottom. We mentioned that day in our report to be a bullish “Shakeout” day. Yesterday’s “Sign of Strength” (large price move with large volume) through the Neckline confirmed the Head and Shoulders bottom (noted in blue lettering). Markets have symmetry and to keep symmetry in GDX a larger “Right Shoulder” needs to develop and bottom around mid to late October in the 15.00 range (give or take). Following the bottom of the Right Shoulder, another rally is expected and breaks through the strong resistance near 16.50. A bullish sign could be triggered later this month.
