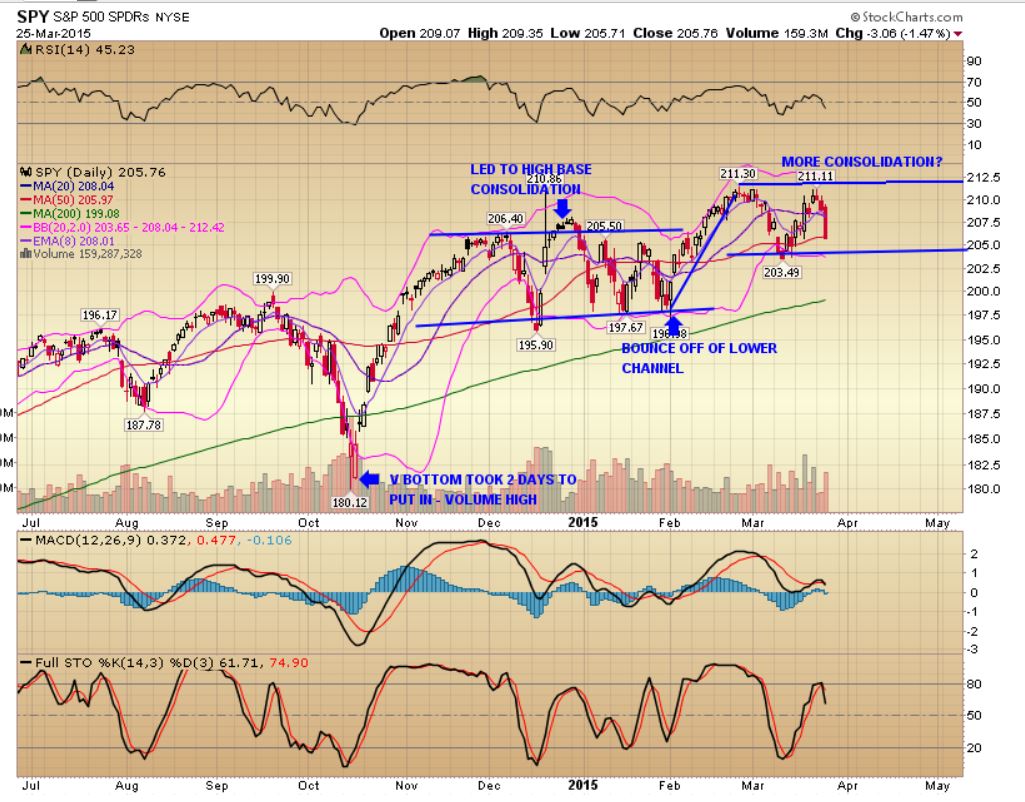
Today I’d like to take a look at the SPY chart to see if I can glean any insight into the current price action.
When I view a chart I like to look for patterns. After the V-shaped bottom was put in in December we went into a multi-month period of consolidation before another spectacular run in February. Since then we have tried to break out above the $211 range making a slightly lower high and defending the 50-day SMA. One thought is that we can simply continue in this higher consolidation while the 200-day SMA continues to move up to lend support for the next upward move. Traders are creatures of habit and often do the same thing over and over again until it does not work anymore. If you look at the bottom of the chart you will see the full stochastics that have turned down, the MACD has turned down, the histogram is stair stepping down and price is falling.
Overbought and oversold can be worked off via time or price. The first scenario is based on the continuation of the current pattern and in this manner overbought would be worked off via time.
The second scenario is now in consideration as by the McClellan Oscillators we are not “technically” overbought or oversold and in fact the drubbing the markets took yesterday did not take us to any extreme levels that would enable us to count on a quick snap-back rally. In other words, the rubber band has not quite stretched far enough in the other direction for traders to rely on a relief rally yet. That being said, we are in end of month, end of quarter markup time.
In addition, we have seasonality factors kicking in with taxes being due in 2 weeks, no real market leadership and price movement based on relatively low volume. Looking at the spectrum of the SPDR ETFs, many are just starting to flash sell signals via my methods of charting with the exception of the (ARCA:XLE) and the (ARCA:XME). Even though we have had 3 consecutive down days in the overall market, I do not think we are done to the downside. A natural target for the SPY is 200 as markets tend to migrate towards big round numbers.
For now I would focus on managing your existing positions and keeping some dry powder to utilize once this phase is over.
Disclosure: I am long spy calls and long spy puts.

