Research Highlights:
- We continue to monitor the $339.50 level as a key resistance level.
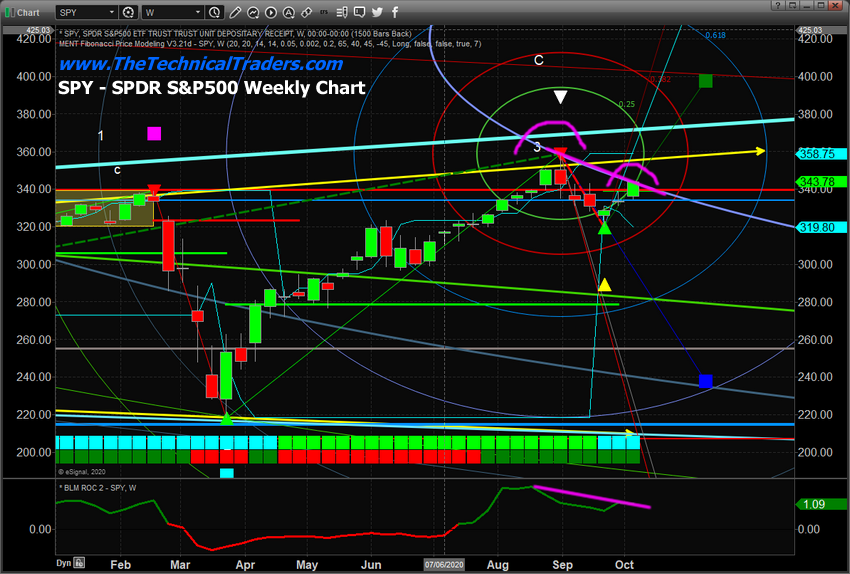
- Our weekly SPY (NYSE:SPY) chart is showing that the Fibonacci Price Amplitude Arc resistance level is acting as a ceiling for price and a downward trend in the momentum indicator.
- The current rally in price may simply be another bull trap set up in a typical “R” price formation near our Fibonacci Price Amplitude Arc resistance level.
- A SPY breakout or rally above $339.50 pushes us closer to the all-time highs, which could then could prompt a new breakout/rally in price.
My research team and I have been watching with keen interest how the markets have continued to trend sideways since setting up a major price peak on Sept. 2. We've continued to suggest general market weakness in the U.S. major indexes was likely to take place after nearly all of the U.S. major indexes rallied above the February 2020 price highs. Our bigger concern was that a bull trap was setting up just 60+ days before the U.S. elections.
Recently, we authored a series of new research articles about sector rotation and how we believe global investors are shifting assets away from risk and into undervalued value sectors. You can read these articles here:
Oct. 7, 2020: STICK WITH THE WINNERS LIKE CLEAN ENERGY
Oct. 8, 2020: COVID-19 HAS PUSHED VARIOUS SECTORS INTO POSITIVE RECOVERY TRENDS
My research team believes the final months of 2020 will be a challenge for all traders/investors as volatility continues to stay nearly 2x to 3x higher than normal and as global investors continue to transition from high-flying sectors over the past 12+ months into undervalued sectors that appear to be breaking into a new upward trend. We believe certain sectors, like housing, freight and heavy equipment, as well as certain retail segments, could continue to do moderately well throughout the Christmas season. Yet, we also believe this transition away from risk may prompt some big downward price trend surprises over the next 60+ days – so traders need to stay keenly aware of risks and cautious of broad market rotations.
Fibonacci Price Amplitude Arc Ceiling Back In Play
Today, we are focusing our research on the SPY chart and how our Fibonacci Price Amplitude Arc from a projected target point many months into the future continues to play a role in creating resistance for the SPY and major U.S. markets. We've mentioned the $339.50 level on the SPY as a key level to watch over the past 30+ days and we've authored numerous articles about the key developments and setup from a technical analysis standpoint. One of the most informative research posts recently was our detailed article on Sept. 6, entitled BIG TECHNICAL PRICE SWINGS PENDING ON SP500, which suggested a broad market decline was setting up.
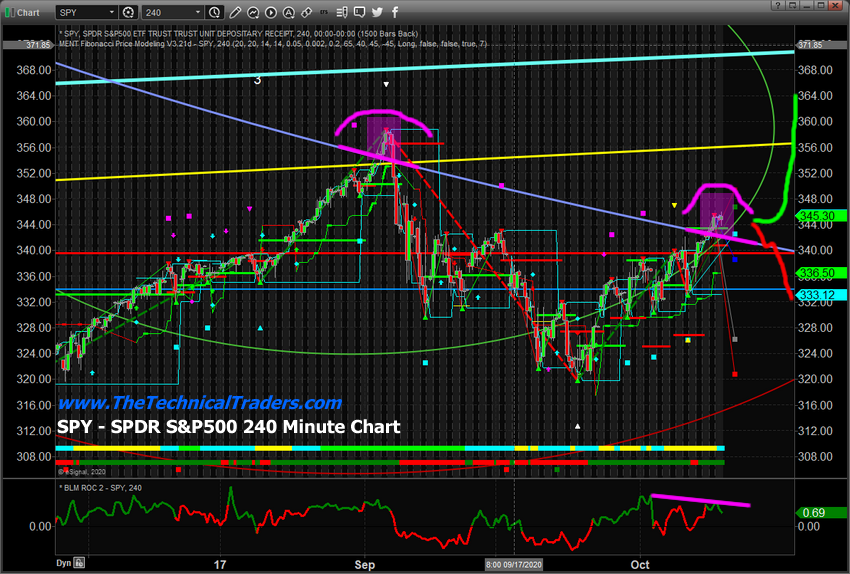
We believe the current price setup in the SPY is similar to the early September peak price action and may prompt another downside price move after briefly testing out these recent high price levels. In other words, the current rally in price may simply be another bull-trap set up in a typical “R” price formation near our Fibonacci Price Amplitude Arc resistance level and traders need to stay extra cautious at this time.
Yes, a breakout trend/rally above this level that pushes back to near the all-time highs could prompt a new breakout/rally in price – but we're not there yet. We believe the indecision and uncertainty related to the U.S. elections will continue to keep the U.S. markets in a mode of paralysis over the next 3+ weeks (or longer). Don't expect much of a price trend over the next three to four weeks and stay very cautious of risks as news, tweets or other items could become major drivers of price rotation over the next 30 to 60+ days.
Notice the two MAGENTA highlighted areas on the SPY 240-minute chart below. These are the areas above the Fibonacci Price Amplitude Arc that present bull trap setups. We have a moderate technical divergence in our momentum indicator and we believe the current price setup is, again, at a make-or-break setup.

This SPY Weekly chart, below, highlights the same setup over a more condensed chart. We can still clearly see the Fibonacci Price Amplitude Arc resistance level acting as a ceiling for price. We can also see the two recent peaks that align with this Fibonacci Price Amplitude Arc. We also have a downward trend in the Momentum indicator near the bottom of the chart. If price fails to hold above the Fibonacci Price Amplitude Arc (with any indecision or uncertainty over the next few weeks), we believe the downside price risk is rather substantial. A breakdown in price at this point could prompt a move below $315 on the SPY – possibly targeting the $280 level again.

Any failure in price to continue to rally will quickly become evident as price should setup a rollover peak very close to the $340 to $350 price level on the SPY. Again, we are nearing a make-or-break price level on the SPY – skilled traders need to be cautious right now.
Jumping into any long-side trades at this time could represent a very real 11%+ downside risk factor. Jumping into any inverse trades could represent a very real 6% to 8% risk. With volatility still 2xto 3x+ the normal price range and price hovering near critical resistance just weeks before the U.S. elections, taking big trades banking on big trends in this market is like taking a dingy out in a hurricane. Best to understand the risks and prepare for stormy weather to ride out the volatility and risks.
Targeted trades in the most opportune sectors with moderate levels of risk are the only real opportunities in our opinion. Swing traders should stay cautious as unknown risks still persist near this critical resistance level and a number of unknowns continue to lurk just below the surface.
