Get 40% Off
🚨 Volatile Markets? Find Hidden Gems for Serious OutperformanceFind Stocks Now

SPY Puzzler: Possible Failed Inverse Head And Shoulders

Published 10/19/2014, 01:28 AM
Updated 07/09/2023, 06:31 AM

S&P 500

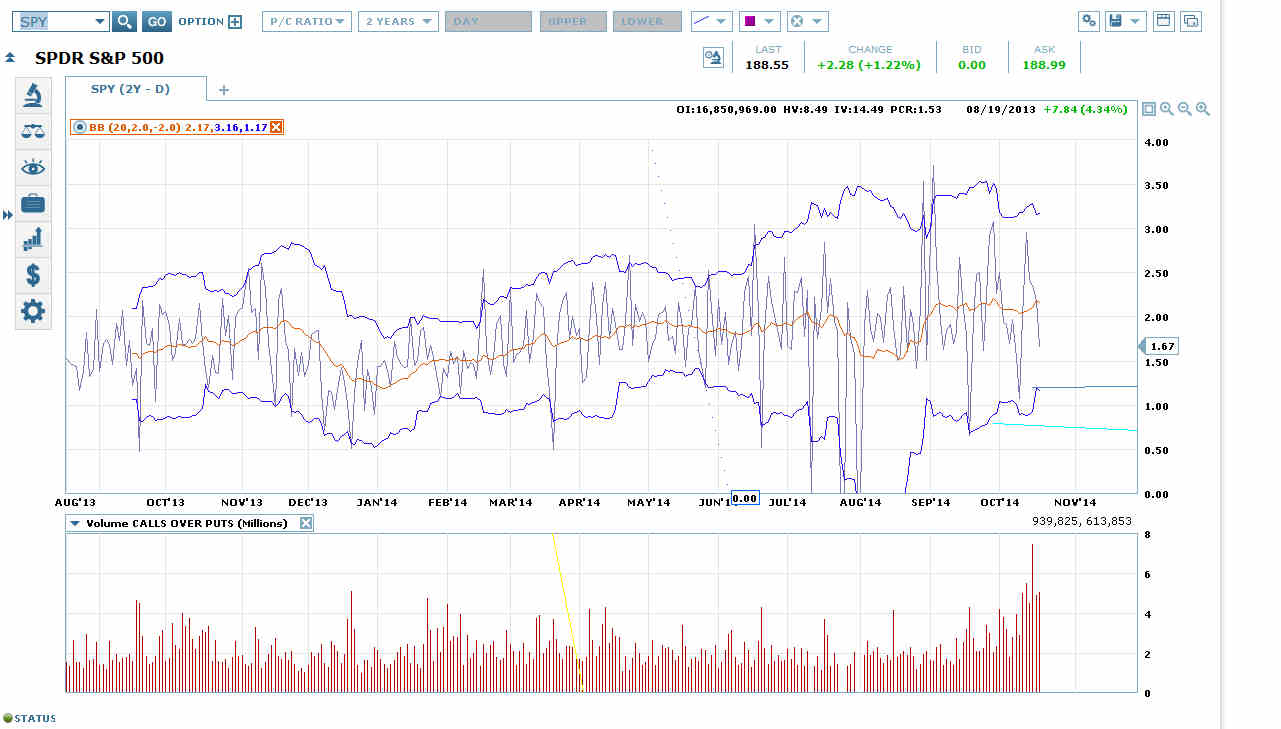
The SPY Put-Call Ratio Closed on Friday at 1.67, Well Below its 20 dma

The SPY put-call ratio closed at 1.67 on Friday, well below its 20 dma. So traders like you and me and everyone else reading this are apparently feeling confident that the bottom is in.

Yet SPY put volume fell by only 6% today on another strong rise in open interest. That means both bulls and bears dug in some more, with nobody backing down. The ratio dropped because of a 22% increase in SPY call volume.

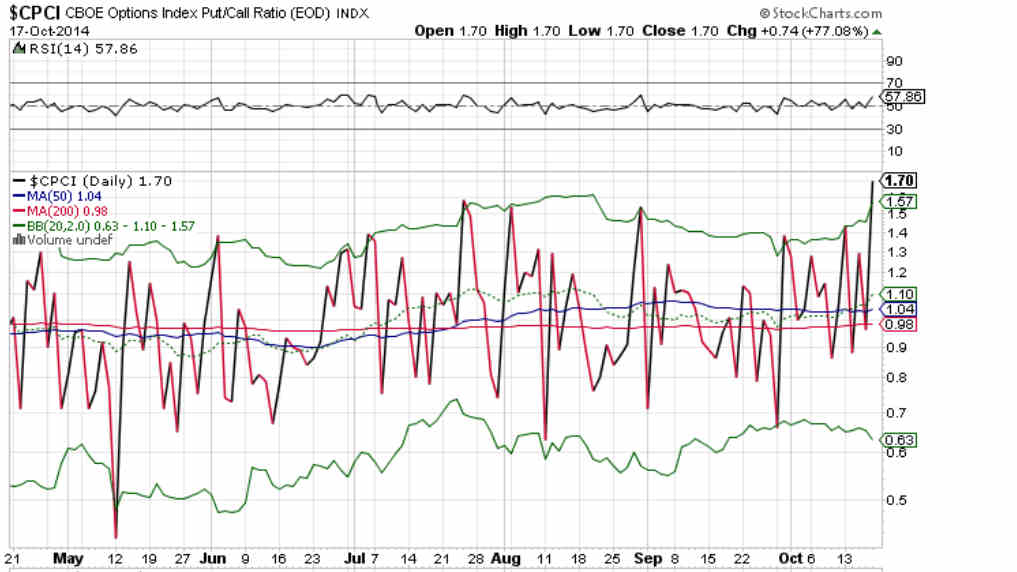
Meanwhile, the big stacks pushed the CBOE index put-call ratio up through its top Bollinger Band® to 1.70. What has them so scared?

CBOE Daily Chart

The CPCI Soared to 1.70 Today, Up Through Its Top Bollinger Band®

The last time the CPCI was this high was on May 30, 2013, as the dip to the June 24 low was getting going.  Recent dates when the CPCI has broken its top Bollinger Band® while the SPY put-call ratio fell a comparable amount to today were July 24, 2014, August 29, 2014, and September 30, 2014.

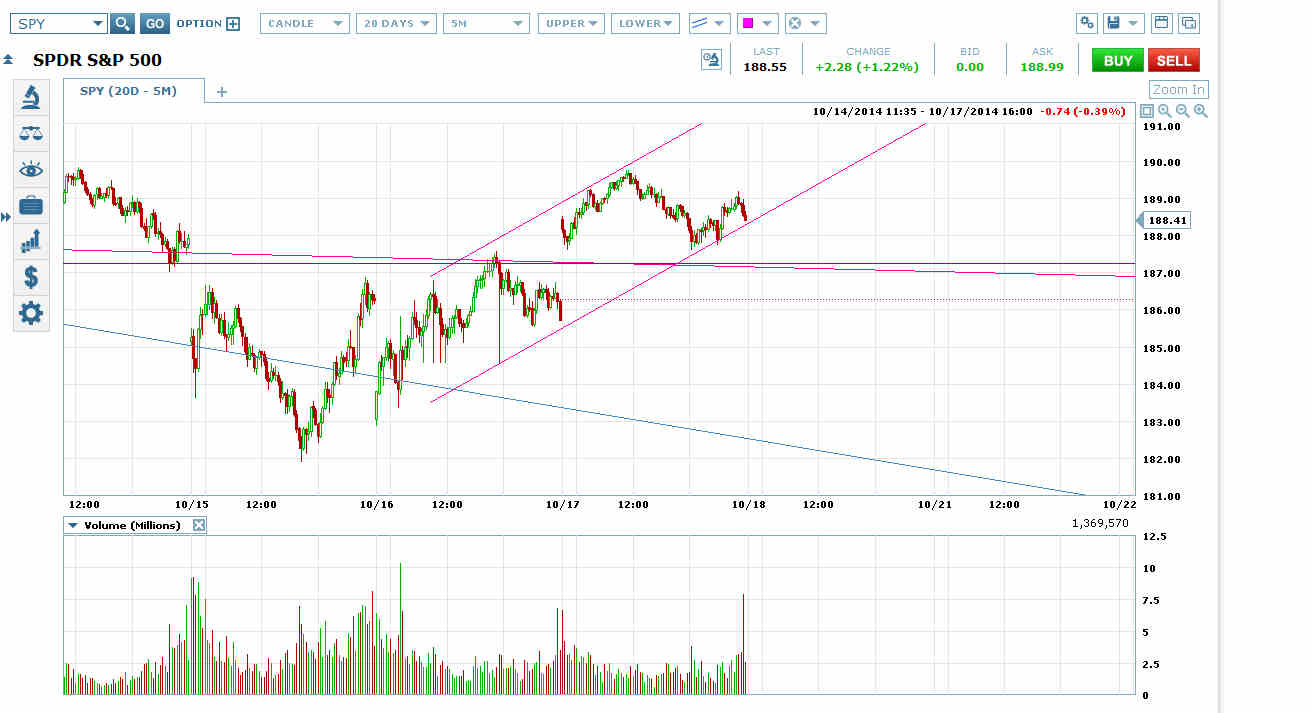
The soaring CPCI occurred on a day when SPY established a new price channel that would usually put in at least one more wave up before starting a sideways move, and could climb up the channel a long way, or even break out into a steeper channel on the next wave up for a melt-up.
SPDR S&P 500 Chart

SPY has Established and Retested a New Price Channel

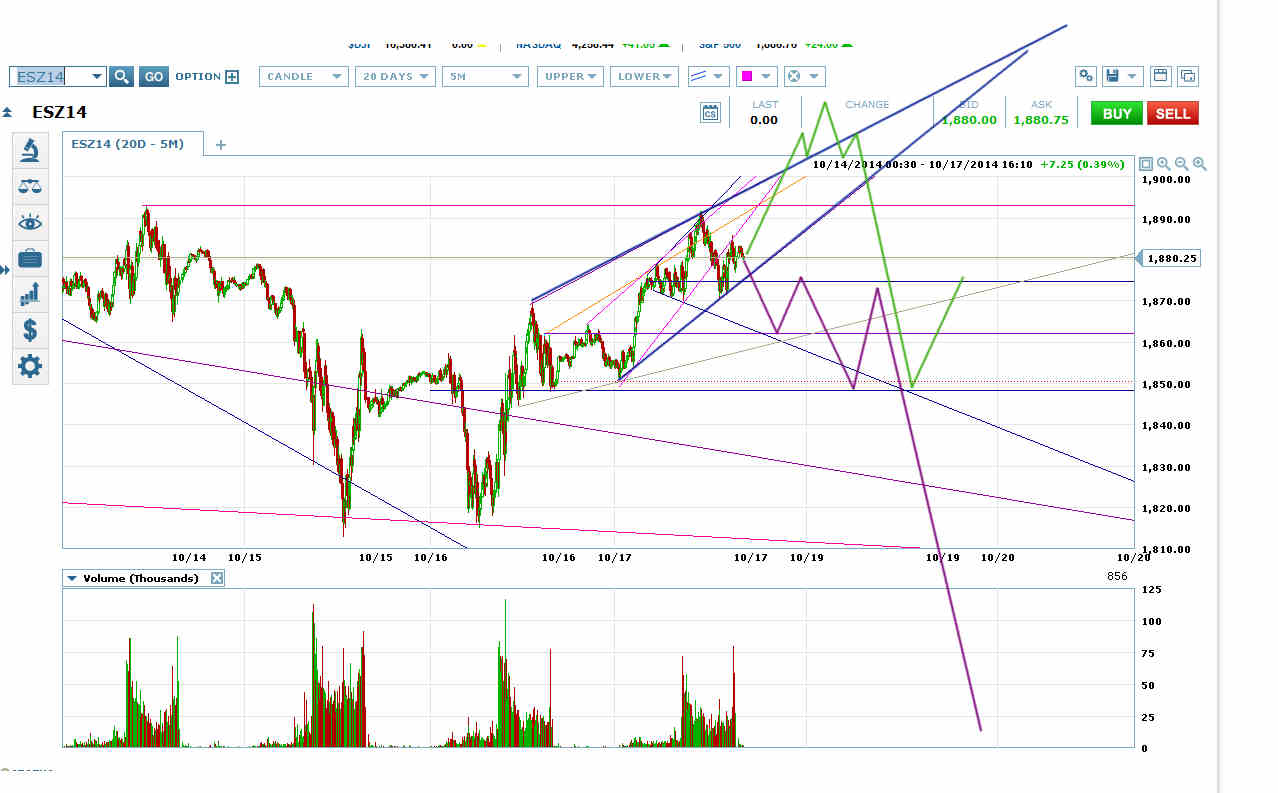
And ES has drawn another potential rising wedge (navy blue on chart below) that would require at least another wave up and then likely some kind of sideways move that would probably climb higher still (green scenario on chart). But the CPCI suggests that something different is about to happen (such as the purple scenario on chart).
3rd party Ad. Not an offer or recommendation by Investing.com. See disclosure here or remove ads .

ES Chart

ES Potential Rising Wedge vs Potential Head and Shoulders

What this means to me is that we should take any downward breakout from the new SPY price channel or ES potential rising wedge very seriously.  It would be a set-up to exit longs and return to short.  It would likely mean a failed right shoulder and downward breakout from the inverse head and shoulders patterns on both charts, and those usually make for strong moves.

Failed bottoming patterns are characteristic of melt-downs.

Original post

Latest comments

Risk Disclosure: Trading in financial instruments and/or cryptocurrencies involves high risks including the risk of losing some, or all, of your investment amount, and may not be suitable for all investors. Prices of cryptocurrencies are extremely volatile and may be affected by external factors such as financial, regulatory or political events. Trading on margin increases the financial risks.
Before deciding to trade in financial instrument or cryptocurrencies you should be fully informed of the risks and costs associated with trading the financial markets, carefully consider your investment objectives, level of experience, and risk appetite, and seek professional advice where needed.
Fusion Media would like to remind you that the data contained in this website is not necessarily real-time nor accurate. The data and prices on the website are not necessarily provided by any market or exchange, but may be provided by market makers, and so prices may not be accurate and may differ from the actual price at any given market, meaning prices are indicative and not appropriate for trading purposes. Fusion Media and any provider of the data contained in this website will not accept liability for any loss or damage as a result of your trading, or your reliance on the information contained within this website.
It is prohibited to use, store, reproduce, display, modify, transmit or distribute the data contained in this website without the explicit prior written permission of Fusion Media and/or the data provider. All intellectual property rights are reserved by the providers and/or the exchange providing the data contained in this website.
Fusion Media may be compensated by the advertisers that appear on the website, based on your interaction with the advertisements or advertisers.
© 2007-2024 - Fusion Media Limited. All Rights Reserved.