I have not been asked this question yet but some days it seems it will be coming. With investor bullish sentiment at prior high levels, the bull to bear spread at extremes, no volume in the market which is overbought, Mercury in retrograde and Neptune stationed direct (no idea what that means), a full moon tonight and Friday the 13th, the market has a lot stacked against it. If it goes up today you had better be balls to the walls be long with all this going on.
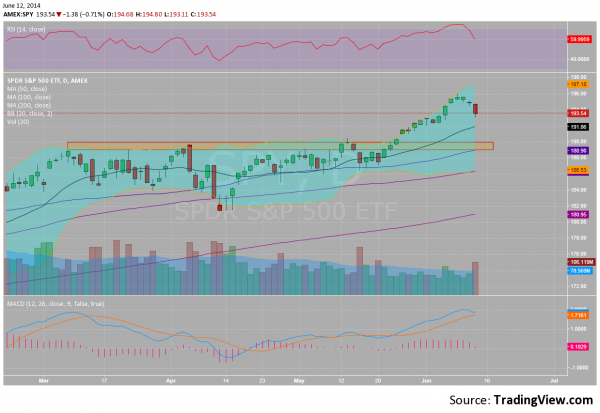
But seriously what does the future look like. Is the top in or is there room for more upside? That answer depends on your timeframe. Using the SPDR S&P 500 (ARCA:SPY), as a yardstick the daily chart has topped at 196 and is pulling back. Will it continue? The long red candle (bad thing) suggest there may be more downside in the near term. And if you are a day trader then that may be important to you. But a pullback even to retest the 190 break out level on this timeframe keeps the trend higher intact.
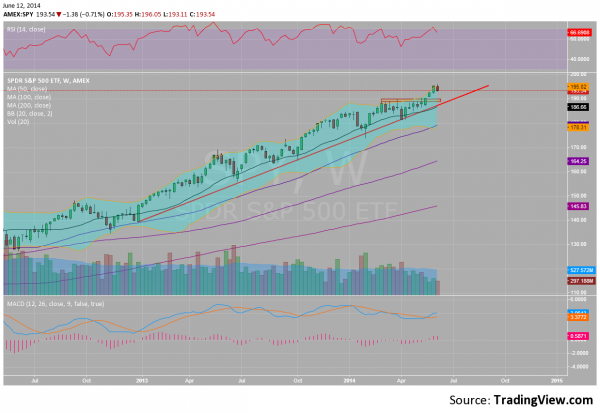
The weekly chart shows a strong trend higher with price extended from support. But, that support could give it even a little more room than the daily chart on a pullback and still remain bullish. The trend is roughly following the 20 week Simple Moving Average (SMA) which is pretty close to the 100 day SMA if you want a proxy on one chart. Like the daily chart the price on the weekly chart has worked off an overbought condition, a positive.

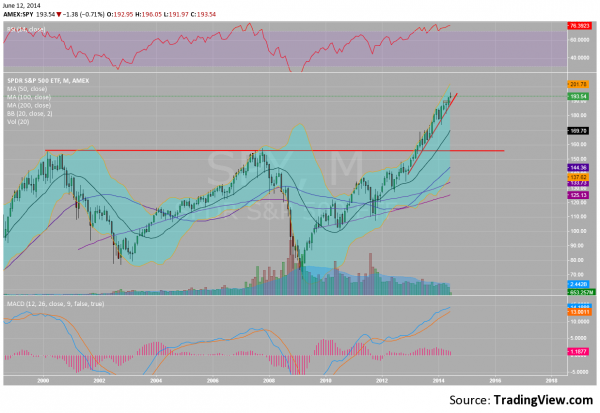
The monthly chart is where the big debate comes in. In the long term the trend has been and looks to continue to be higher. But some believe that the move above the break out line without any pullback cannot sustain itself. That the breakout level needs to be retested. A retest may come but it is in no way a requirement. One set of investors see the breakout higher as move out of a 10 year range. They will not sell quickly. The momentum indicators are running higher. They are at high levels and where price has reversed in the past but that does not mean they and price cannot continue to higher.
So what to do?
1. Stay invested.
2. Protect positions with stops and options (collars or protective puts).
3. Pay attention to your positions, not the broad market.
4. Don’t be afraid to enter a new position that is moving, with the protections above.
Disclaimer: The information in this blog post represents my own opinions and does not contain a recommendation for any particular security or investment. I or my affiliates may hold positions or other interests in securities mentioned in the Blog, please see my Disclaimer page for my full disclaimer.


