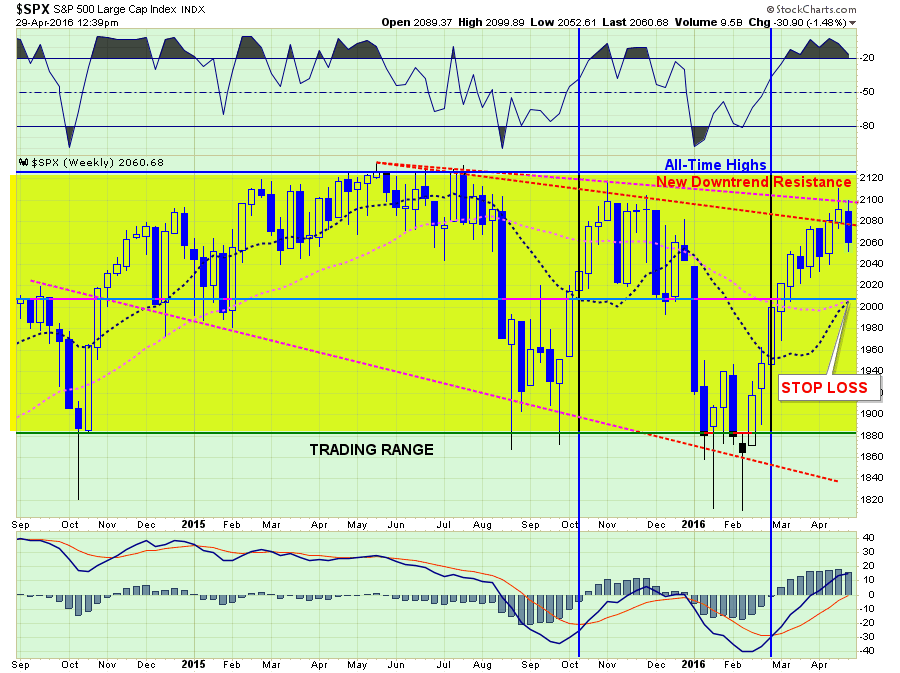
I recently talked about the S&P 500's ongoing trading range.
First of all, it is worth noting that despite all of the recent excitement of the markets advance, it remains extremely confined in a sideways trading range. This can either be good or bad news.
The Good: Sideways consolidations during bullishly biased markets provides the ability to work off excesses built up during the previous advance to provide the “fuel” necessary for the next leg higher.
The Bad: However, sideways consolidations can also mark the end of the previous bullish advance and the beginning of a bearish decline.
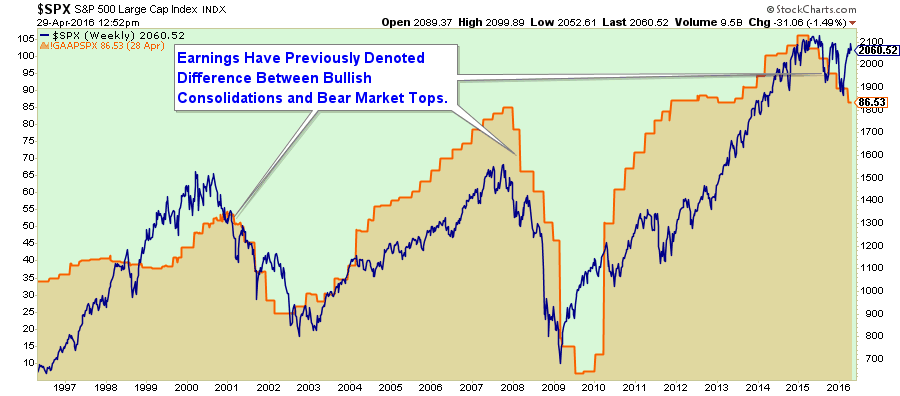
How do we know the difference? Normally, fundamentals tell the story. When earnings are still rising, market consolidations tend to resume to the upside. However, declining earnings have historically marked market topping processes much as we see today.
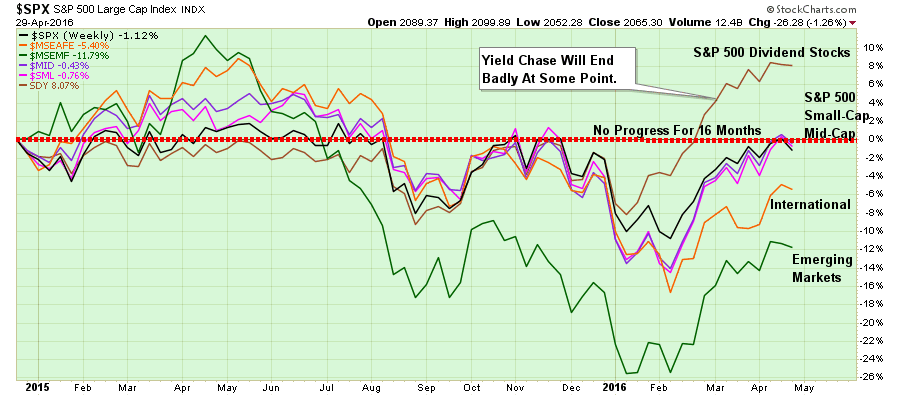
Despite the roller-coaster ride over the last 16 months, most of the major markets have made little or no progress. That is with the exception of the recent explosion in large-cap, dividend-paying companies. This “yield chase” puts investors into a tremendous amount of risk as historically such “investment crowding” tends to end badly.
The real problem is the mentality behind the crowding of investors into “yield stocks.”
The Fed’s zero-interest policy has driven investors from normally more secure forms of income (bonds and money-market funds) into equities in a quest to generate income. Furthermore, it is currently believed that dividend-paying companies are “safer” than other areas of the market.
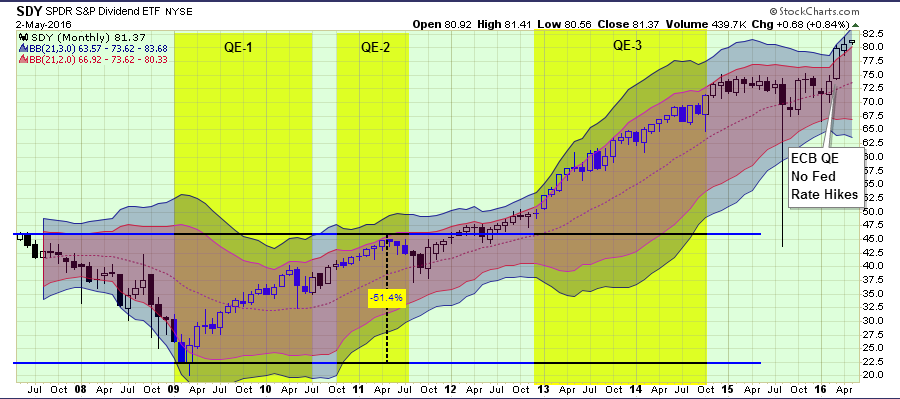
The problem for investors, as shown below, is that such beliefs tend to be wrong at the worst possible time. During the last recessionary driven sell-off, dividend-yielding stocks lost 51.4% of their value. It took two rounds of quantitative easing and three and one-half years to get back to even. The problem is many investors dumped their stocks in 2008 and 2009 and failed to get back in until much later. In either case, years of an individual’s saving and investment time horizon was lost.
During the next recessionary drag, several things will again happen. The first is that companies will cut dividends, as they are doing now, driving yields lower. This is shown in the chart below courtesy of Political Calculations:
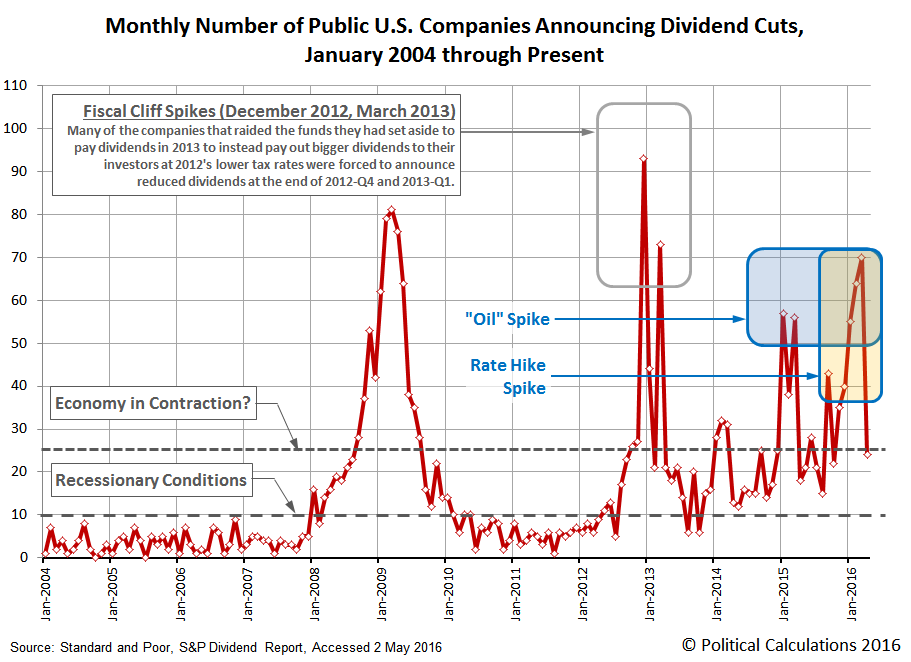
For the first time since October 2015, the number of U.S. firms that announced dividend cuts during a calendar month dropped below the level where we can be reasonably certain that at least part of the U.S. economy is experiencing significant contraction.
But the bad news is that at 24 firms, the still elevated number of dividend cutting firms who communicated that they are experiencing economic distress during April 2016 indicates that the U.S. economy is pretty far from being out of the woods.
Secondly, companies will cease “buying back shares” to boost bottom line EPS, which will take away a level of support for stock prices. Furthermore, the majority of these repurchases have been through debt accumulation, which is now back at peak levels. What could go wrong?
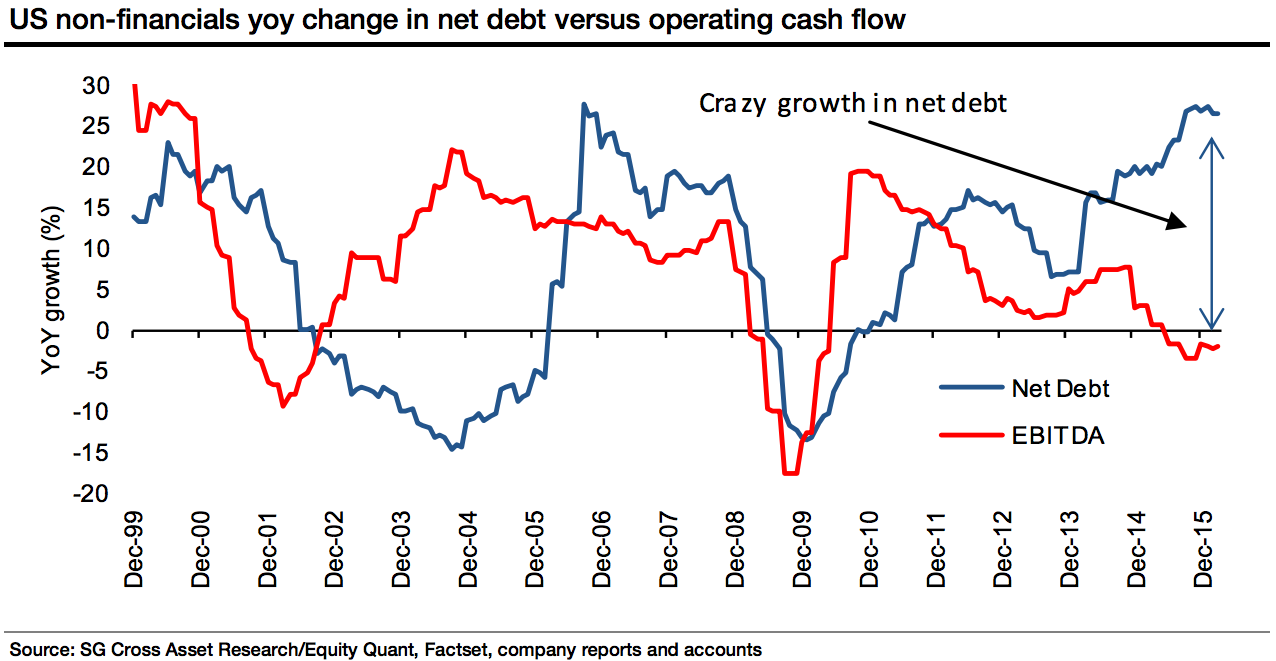
Finally, the lack of support will lead to falling stock prices, which will destroy years of dividend accumulation for investors. Ultimately, the “yield chase” will end, as it always does, with investors giving up on the idea of “owning stocks for the long run” in exchange for “I need to keep what bit of value I have left in my portfolio.”
I agree with Jeff Gundlach’s recent statement:
The riskiest things are now stocks and other investments perceived to be safe. One of the most popular categories in US investing are low volatility stock funds. But there is no such thing! If you think that a stock like Johnson & Johnson (NYSE:JNJ) can’t go down, you’re wrong. And if people own funds that invest in stocks which they think are immune from decline and they start to decline, all hell breaks loose.
Market To Nowhere
Let’s get back to the current market. As we enter May and the end of the seasonally strong period of the year, it is worth noting that the markets are still trading lower. However, during that time frame, the market has certainly experienced a sharp rise in volatility, which has left investors questioning the efficacy of their preferred investment strategies.
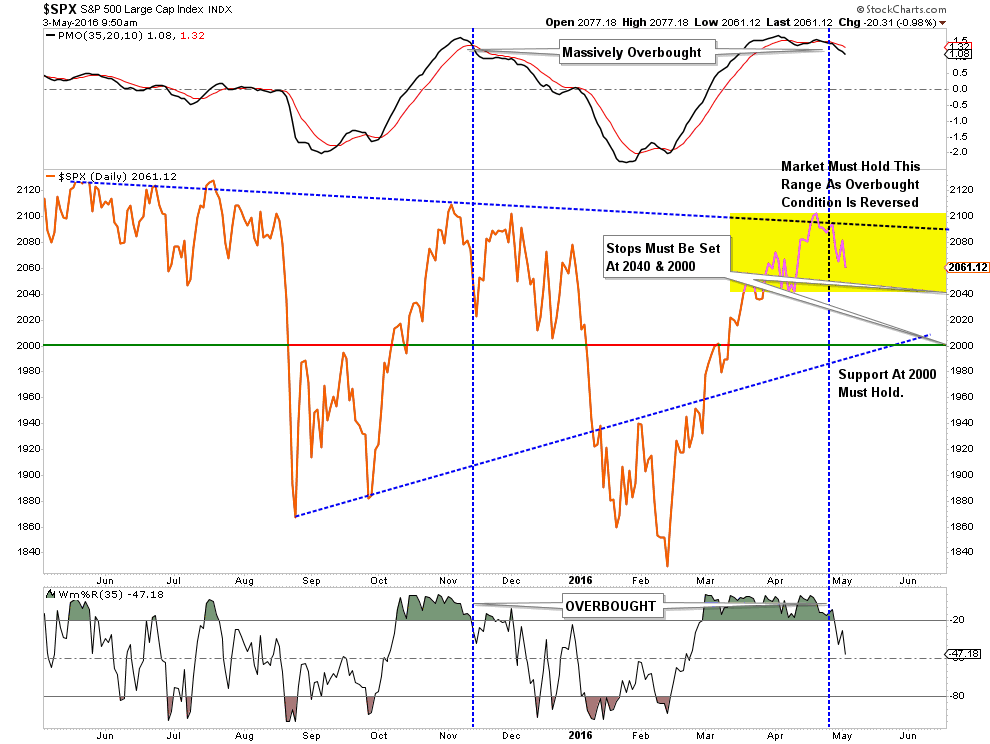
As you are well aware, I increased equity exposure in portfolios when the markets broke above 2080 moving above the downtrend resistance from the May highs. As I stated then, by the time that such a move occurs the market is overbought and requires some consolidation before attempting a push higher.
In the chart below, you will see the extreme overbought condition of the market currently and the current process of reduction. Importantly, the last time such extremes existed was in November of 2015 heading into the Fed rate hike. That hike led to a critical unwinding of positions at the beginning of this year.
Currently, I DO NOT BELIEVE the Fed will hike rates further at any point prior to the November election. With employment and inflation data now hitting the Fed’s “targets” for “normalizing rates” the new “perma-excuse,” as coined by Danielle DiMartino-Booth, for not hiking rates is now – “global weakness.”
As long as the Fed signals ongoing “accommodation” by not hiking rates, the markets will continue to hold on to the belief that “stocks are the only game in town.”
This is a risky proposition at best as earnings and profits continue their normal reversion process which, just to remind you, is driven by “real” economic activity. Eventually, the current “fantasy” of stock prices will have to meet the “reality” of economic underpinnings.
The question is whether the Fed can successfully convince investors to remain in stocks, keeping prices elevated, long enough for the economy to complete a recessionary cycle and return to growth?
While it is has never happened before in history, could this be the first time that the Fed is able to “engineer” a “soft-landing” scenario in the economy?
Anything is certainly possible, however, the probability is more akin to a 2000 or 2008 scenario as the decoupling of the markets from the economy is corrected.
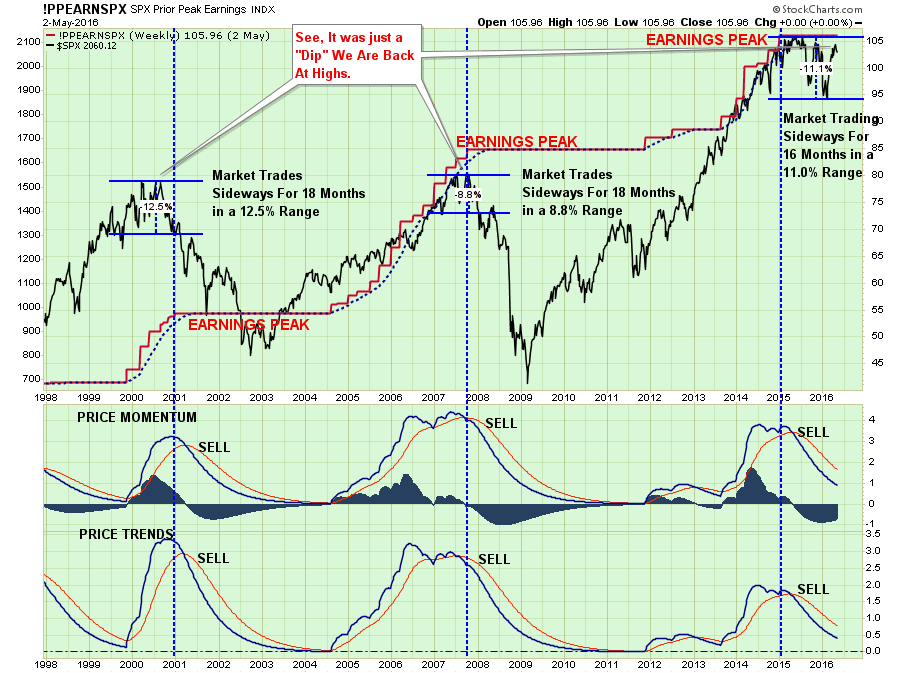
As shown in the long-term chart above, the ongoing current topping process is very similar to what has been seen previously. Earnings have peaked, price trends are weak and the “market to nowhere” has existed for 16-months.
Eventually, the sideways trading market will end. The only question will be the catalyst that pushes stock prices higher or sends investors panicking to the sidelines.
I suspect we will find out that answer much sooner than most expect.
The stock market is like a carousel; you can get on and off horses at any time. – Ron Miller
