REVIEW
US markets rise for third week in a row. The week started off with a gap up on monday, and then continued to rise every day until thursday. When it hit a new all time high at SPX 1995. A pullback on friday ended the week at SPX 1988. For the week the SPX/DOW were +1.85%, the NDX/NAZ were +1.65%, and the DJ World indix rose 1.2%. Economic reports for the week were all positive until the WLEI downticked on friday. The upticks: the NAHB, the CPI, housing starts, building permits, existing home sales, the Philly FED, leading indicators, the monetary base, and weekly jobless claims declined. Next week we get an update on Q2 GDP (est. +4.0%), PCE prices and the Chicago PMI.
Long Term: Bull Market
This bull market continues to unfold in five Primary waves from the March 2009 low. Primary waves I and II completed in 2011, and Primary wave III has been underway since that October 2011 low. Primary waves I and III have both divided into five major waves. During Primary I only Major wave 1 subdivided. During Primary III Major waves 3 and 5 are subdividing. Major waves 1 and 2 completed in late 2011. Major waves 3 and 4 completed in early 2014. Major wave 5 has been underway since that February 2014 low.
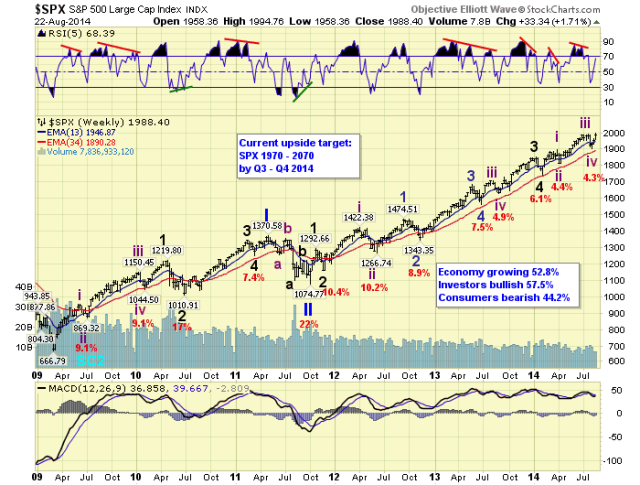
Several months ago we detailed how and why Major wave 5 should subdivide in the SPX/DOW. While the NDX/NAZ completed their Major waves. The end result would be a completed Primary wave III. This would be followed by a Primary wave IV and the largest correction since 2011. We estimated the SPX would complete five Intermediate waves, which it appears to be doing. The DOW would complete a diagonal triangle Major wave 5. And, the NDX/NAZ would complete their Major 3, 4, 5 wave pattern.
For the past three weeks we have been noticing deviations in our monitor portion of our: project-monitor-and adjust when necessary mantra. While the SPX looks fine, as noted above. The DOW and NDX/NAZ have all deviated from what was expected. This deviation suggests the market may have evolved into an alternate count, and Primary wave III may not end soon. This will be explained near the end of the report.
Medium Term: Uptrend
Last week the NDX confirmed its uptrend. This week the SPX/NAZ confirmed their uptrends. The DOW has yet to confirm, but this should occur shortly. We continue to count this uptrend as Intermediate wave v of Major wave 5. Thus far this uptrend has had three decent rallies: 1905-1945, 1928-1964 and 1942-1995. The first rally and pullback (1945-1928) we counted as Minor wave 1 and 2. The next rally and pullback (1964-1942) we counted a Minute waves i and ii of Minor 3. And, this last rally and pullback (1995-1985 so far) is being counted as Minute waves iii and iv of Minor 3, (see hourly chart).
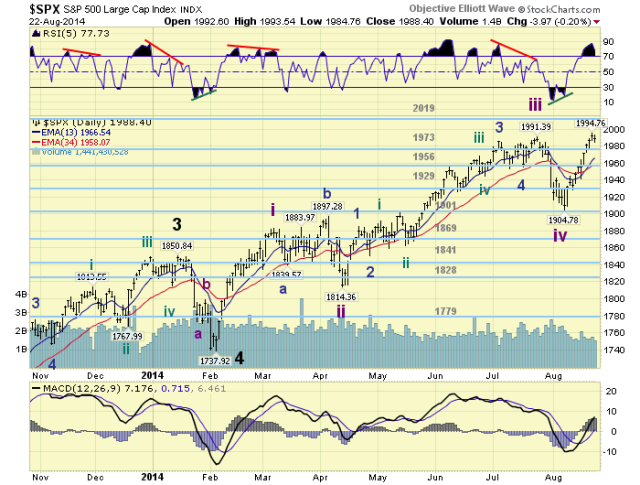
We noted last week that SPX 1993 and 2000 should come into play as Minor 3 unfolds. Minute iii topped at SPX 1995 this week. The next set of ranges we see are SPX 2000 to 2008, the 2019 pivot range, and then SPX 2033 to 2036. Minor wave 3 should top in one of these ranges. Since Minute wave iii was larger than Minute i, Minute v can be any length. Also, with the daily RSI just getting overbought this week, and the MACD just turning up, it is probably too early to even be considering an uptrend high next week. We will leave that to the weeks ahead. Medium term support remains at the 1973 and 1956 pivots, with resistance at the 2019 and 2070 pivots.
SHORT TERM
Short term support is at SPX 1985 and the 1973 pivot, with resistance at SPX 1995 and the 2019 pivot. Short term momentum ended the week just below neutral. The short term OEW charts ended the week at neutral, with the reversal level at SPX 1988.
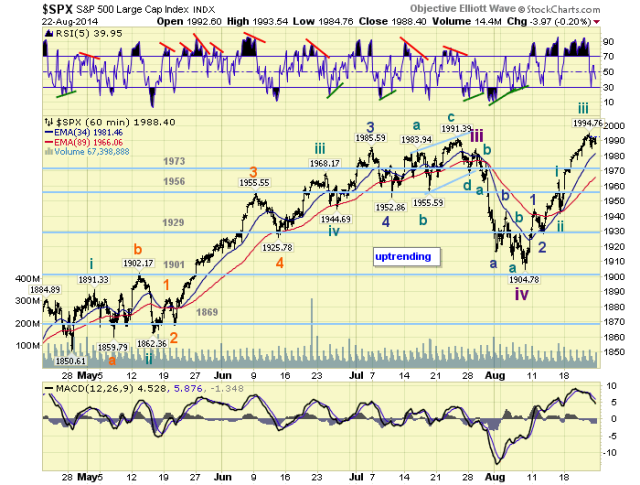
The short term count within the uptrend continues to unfold as expected. The question now is how deep a pullback for Minute wave iv. Thus far it has declined 10 points, SPX 1995-1985. Previous pullbacks have been a bit larger: 22 points for Minute ii, and 17 points for Minor 2. Initially, with friday’s oversold condition, it looks like 10 points might be enough. However, with the 34 EMA at 1981 and the potential for a lower low setting up a positive divergence. We may see additional downward pressure on monday. SPX 1973 to 1978 appears to be the normal range for this uptrend, but 1981 may just be enough. After Minute iv concludes, Minute v will be underway to new all time highs.
Potential Alternate Count
While we are maintaining our primary counts, noted above. We have noticed some deviations from what was expected during these past few months. The SPX, as you can see in the charts above, looks fine. The problems we are seeing are in the NAZ and the DOW. Since these two indices are key to our market observations, these deviations are worth noting.
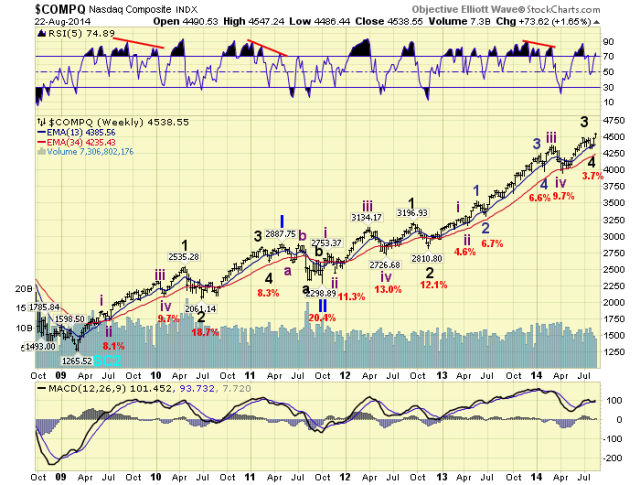
At first glance the NAZ looks fine. But if you look closer, the recent correction which is labeled Major wave 4 was only 3.7%. That is the smallest correction of the entire bull market. This, in itself, is quite unusual for an important fourth wave. In fact, the previous correction, of a lesser Intermediate degree, was 9.7%. Historically this does not look quite right. It actually looks like a correction of a lesser degree.
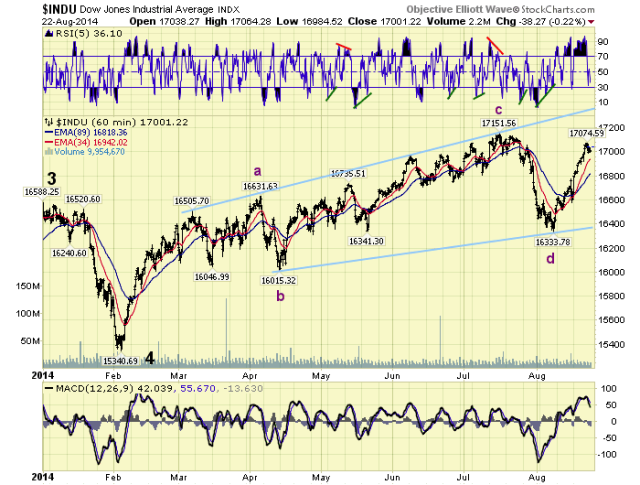
The DOW was expected to form a contracting diagonal triangle Major wave 5. But look at what occurred to the contracting triangle. It now has the look of an expanding triangle. Historically I never observed this wave formation in the DOW.
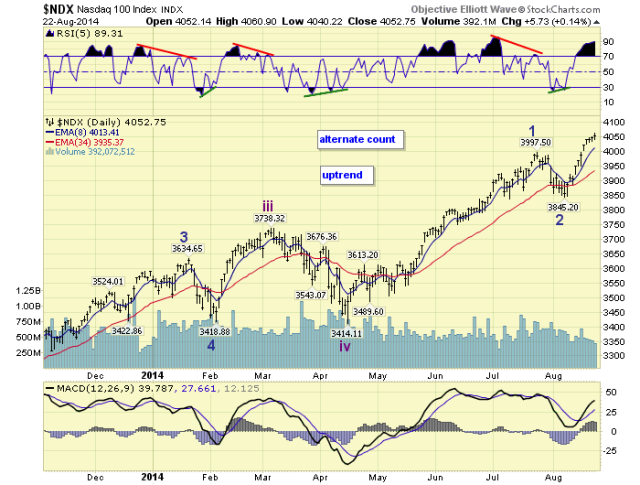
Both of these points may, in the end, prove to be insignificant. But if they are not, they could be telling us Major wave 5 in the SPX/DOW, and Primary III in the NDX/NAZ is about to extend in time and price. With this possibility in mind we arrived at two alternate counts that are worth watching.
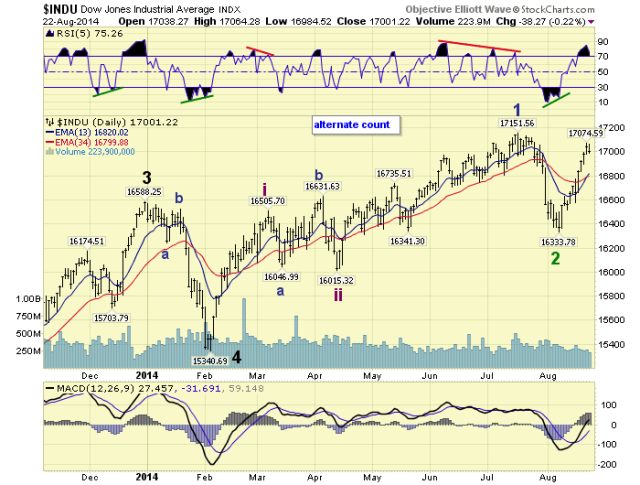
For now we will consider the trigger mechanism of the primary versus alternate count to be the DOW’s expanding triangle. Should the DOW rally strongly during this uptrend, and significantly clear the upper rising trend line, we will consider the extension is on. If the uptrend ends within the upper trendline the primary count remains in play. Something to watch in the weeks ahead.