I did not blog for a while and want to apologize to everyone who checked my blog during the last months and did not find any updates. There were several reasons I could not find the time for posting.
First, the September- November period is the busiest time of the year for our small business. Second, I spend many hours preparing to the level 3 exam in the CMT program. Third, I took time to work on some aspects of my trading approach. I experimented a lot with 2-box reversal charts in particular. I absolutely love what I see so far. Though 3-box and 1-box reversal charts are the most popular charts in the Point and Figure analysis, I found that the 2-box reversal charting method suites my trading style very well and has some advantages over 3-box charts.
First of all, 2-box reversal charts are more sensitive. It allows to control risk better in the short-term keeping the asymmetric filter intact at the same time.
Vertical price counts on a 2-box reversal chart are shorter in general than on a 3-box reversal chart. It creates more price levels which deserve attention and may be hidden on a 3-box reversal chart. One of characteristics of 1-box reversal charts I like especially is horizontal count calculation from congestion areas. This calculation is more suitable for 2-box reversal charts than for 3-box reversal charts and can provide good results.
Objective trend lines are more sensitive on 2-box reversal charts than on 3-box reversal charts and have substantially less false breaches than on 1-box reversal charts.
It doesn’t mean that 2-box charts are superior to 1-box or 3-box charts, all of them have their advantages. I have found that this construction method is just more suitable for my trading style and time horizon. Nevertheless, I keep analyzing all kind of P&F charts to keep different perspectives.
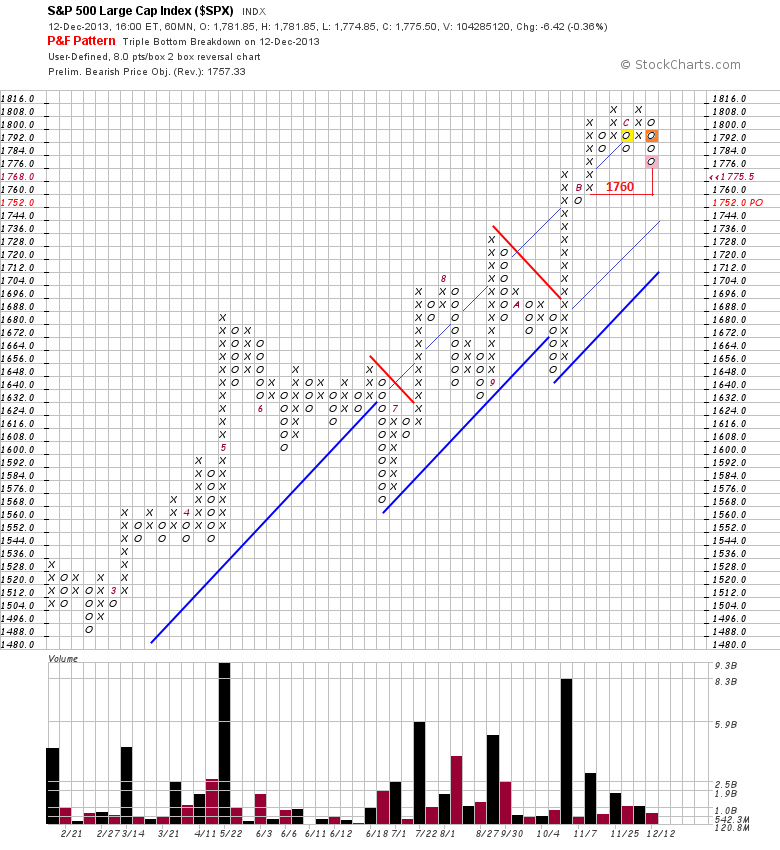
So, let’s take a look at the SPX recent price action on the medium horizon 8x2 60 min P&F chart.
We see that since the October interim bottom at 1648 the price built three X columns interrupted with 2-box columns of Os until it reached 1808. Every consecutive column of Xs was shorter and on lower volume than a previous one. The pattern became clear when the price reversed in a column of Os from the 1808 top in December and fell to 1792 (yellow box). At that moment a trader received a message that the bullish pressure had been weakening and those with long positions should be on alert. The price plotted one more O and reversed in a new X column only to be rejected from resistance and decline in a new column of Os (orange box). The pattern of shorter X columns on lower volume got its continuation; in addition a new pattern of longer O columns on higher volume appeared. We observed the increasing supply but there was still a probability that this lateral move resolves to the upside. Today, however, the price has fallen to 1776 generating a Triple Bottom sell signal (pink box). It is not a signal to open short positions as the SPX is still in the uptrend on this time frame but it is definitely a signal to consider lightening up on long exposure. The vertical and horizontal counts from the November-December top point to 1760 as a current potential destination target for this decline.
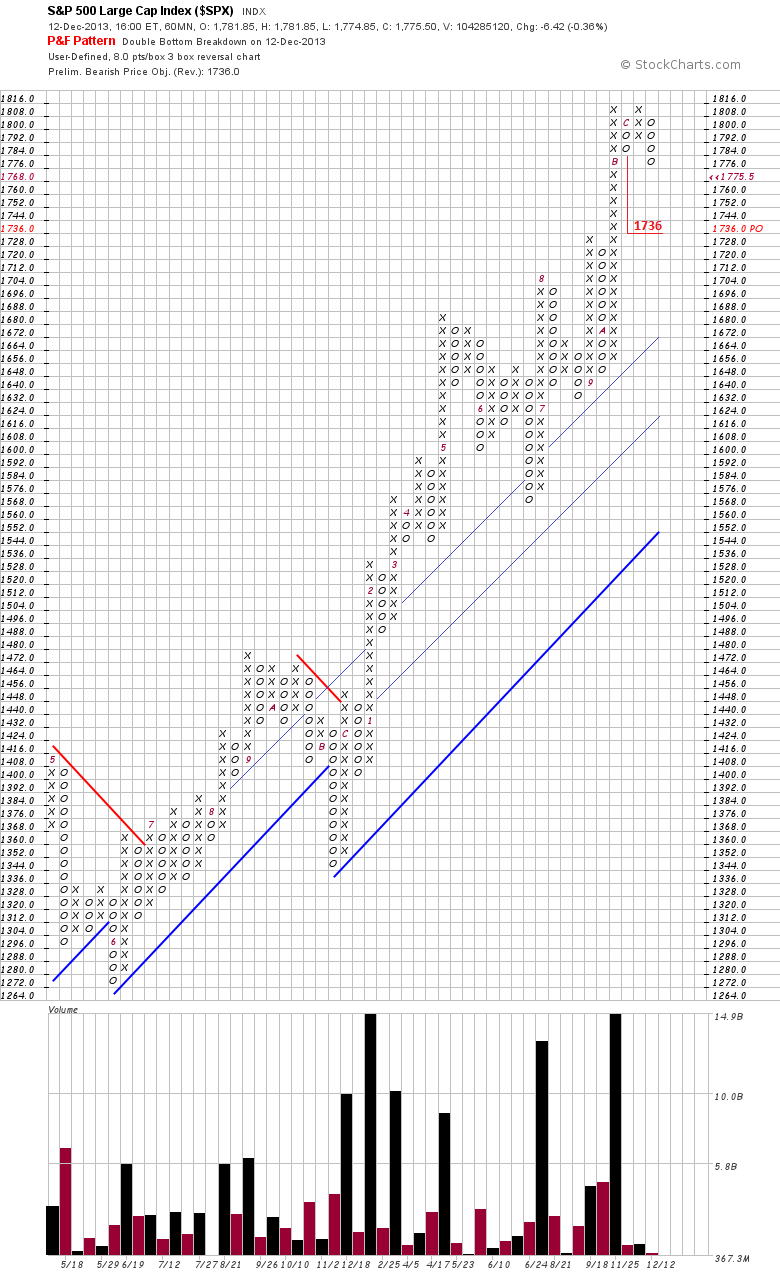
In conclusion I want you to look at the SPX 3-box reversal chart with the same box size and note how much more information is revealed on the SPX 2-box reversal chart.
Disclaimer: I express only my personal opinion on the market and do not provide any trading or financial advice (see Disclaimer on my site).
- English (UK)
- English (India)
- English (Canada)
- English (Australia)
- English (South Africa)
- English (Philippines)
- English (Nigeria)
- Deutsch
- Español (España)
- Español (México)
- Français
- Italiano
- Nederlands
- Português (Portugal)
- Polski
- Português (Brasil)
- Русский
- Türkçe
- العربية
- Ελληνικά
- Svenska
- Suomi
- עברית
- 日本語
- 한국어
- 简体中文
- 繁體中文
- Bahasa Indonesia
- Bahasa Melayu
- ไทย
- Tiếng Việt
- हिंदी
SPX Sends Signal To Lighten Up On Long Exposure
Published 12/13/2013, 01:12 AM
Updated 07/09/2023, 06:31 AM
SPX Sends Signal To Lighten Up On Long Exposure
Latest comments
Install Our App
Risk Disclosure: Trading in financial instruments and/or cryptocurrencies involves high risks including the risk of losing some, or all, of your investment amount, and may not be suitable for all investors. Prices of cryptocurrencies are extremely volatile and may be affected by external factors such as financial, regulatory or political events. Trading on margin increases the financial risks.
Before deciding to trade in financial instrument or cryptocurrencies you should be fully informed of the risks and costs associated with trading the financial markets, carefully consider your investment objectives, level of experience, and risk appetite, and seek professional advice where needed.
Fusion Media would like to remind you that the data contained in this website is not necessarily real-time nor accurate. The data and prices on the website are not necessarily provided by any market or exchange, but may be provided by market makers, and so prices may not be accurate and may differ from the actual price at any given market, meaning prices are indicative and not appropriate for trading purposes. Fusion Media and any provider of the data contained in this website will not accept liability for any loss or damage as a result of your trading, or your reliance on the information contained within this website.
It is prohibited to use, store, reproduce, display, modify, transmit or distribute the data contained in this website without the explicit prior written permission of Fusion Media and/or the data provider. All intellectual property rights are reserved by the providers and/or the exchange providing the data contained in this website.
Fusion Media may be compensated by the advertisers that appear on the website, based on your interaction with the advertisements or advertisers.
© 2007-2024 - Fusion Media Limited. All Rights Reserved.
