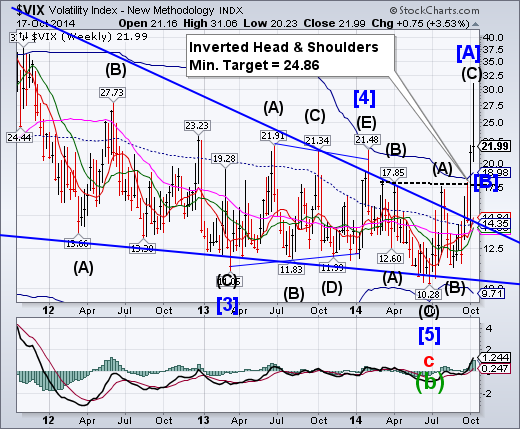
-- VIX achieved its inverted Head & Shoulders target last week, plus another higher target given to subscribers.The fractal pattern in VIX has surprised most observers and may repeat the pattern yet again.
SPX has failed at Long-term support.
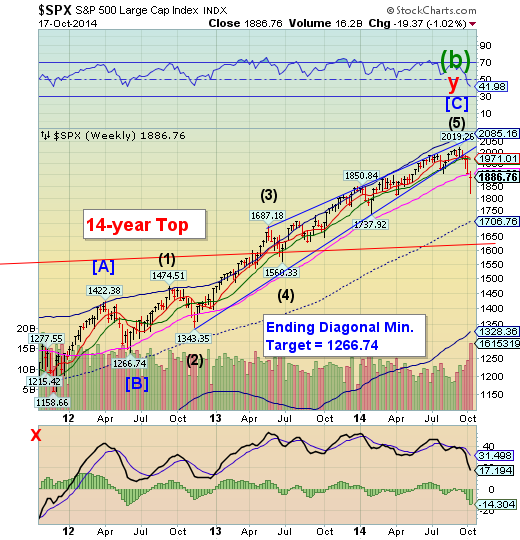
SPX has now failed at Long-term support at 1903.30.What is worse, it closed beneath it, losing all near-term support until it reaches mid-Cycle support at 1706.76.As mentioned last week, “Once Long-term support is broken, it may become resistance.” There is a high probability of a panic decline over the next 2-3 weeks..
Technical analysis suggests that an Ending Diagonal may be completely retraced, once broken. A long-term Cyclical change of trend occurs once beneath mid-Cycle support/resistance, which has not been broken since 2011.
(ZeroHedge) "It could never happen again... right?"
And if you think this time is different - just take a look at the 'tricks' they used 27 years ago to stop the fall - A Fed statement and broken/halted exchanges...
"This is a market that has been seriously overvalued for some time," exclaims Paul Tudor Jones,"and what we are seeing today is the piercing of the bubble..." adding that "Wall Street was uniformly unprepared for this kind of a drop."
NASDAQ Composite closed beneath its Ending Diagonal trendline.
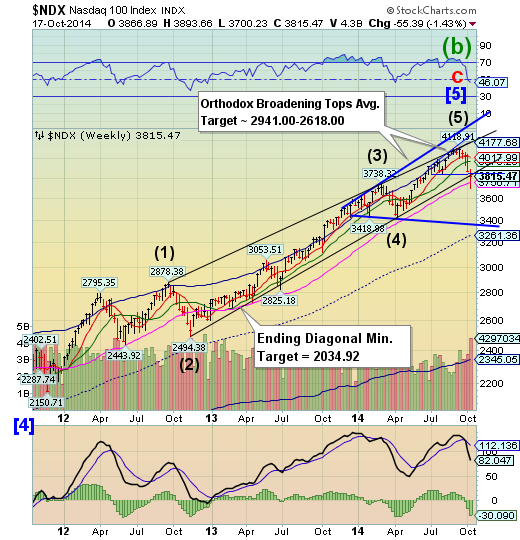
NDX broke its Ending Diagonal trendline and its Orthodox Broadening topnear 3820.00 and closed beneath them. Current analysis suggests the decline may reach or exceed mid-Cycle support at 3261.36, wiping out the entire gain of the last 12 months.
(ZeroHedge) Many market participants are looking dumbstruck at the miraculous surge in Dow Transports, Small Caps, and Homebuilders this week off the bond-short-puke lows of Wednesday morning. The answer - sadly for those who believe this is presaging new new highs and utopia once again - is that this was the biggest weekly short-squeeze in 11 months... and more troubling for the bulls - it ran out of steam today.
"Most Shorted" stocks (BBG Ticker GSCBMSAL Index) rose 3.3% on the week...
High Yield hit an air pocket and hasn’t recovered.
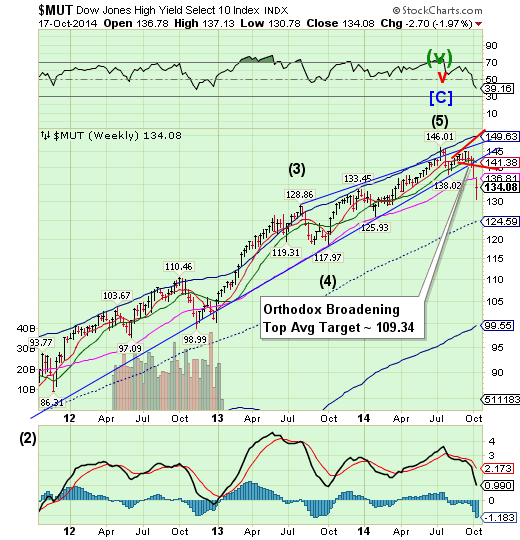
The High Yield Index broke throughthe final near-term support level at 136.81 and was unable to recover its losses by Friday’s close.High Yield may be on the edge of a cascading decline to the next support level to 124.59 and lower.Now is time topay attention to the Orthodox Broadening Top formation which forecasts a much lower outcome.This is not a time to buy, despite the opinion below.
(Forbes) Opportunities are being presented to high-yield investors as the market seeks a floor in a fifth consecutive session. One investor says, “outside of 2009 this is the best entry point into [high-yield] in over a decade,” and is assembling a new portfolio to take advantage of the conditions.
In new issues, the HCA 5.25% bonds due 2025 are up for sale below par issuance for the first time since pricing last week. The $1.4 billion issue of BB/Ba3 secured notes was trading into bids just under par today, versus 100.5 yesterday and highs around 100.75 a day after the break, trade data show.
The Euro bounce may be over.
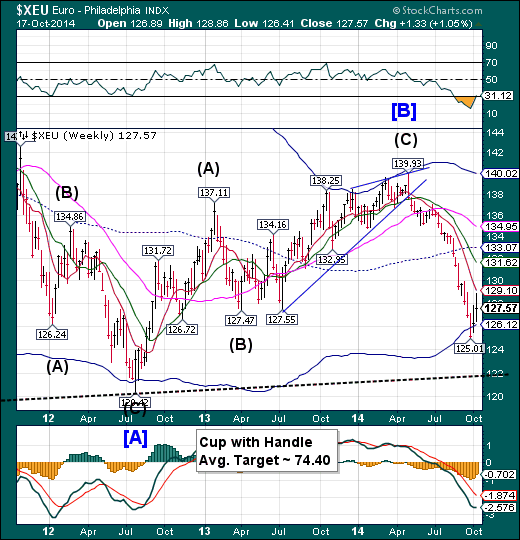
The two-week bounce in the EUR from its Cycle Bottom support at 126.12 may be over.It may now be ready topierce the Lip of a Cup with Handle formation at 122.00shortly, setting up a cascading decline. It may be brief, lasting less than three weeks, but the outcome may be devastating to those in Euro-denominated assets.
(WSJ) Several global banks have begun charging large customers to deposit their money in euros, a rare move that could have costly implications for investors and companies that do business on the Continent.
The actions are driven by policies from the European Central Bank, which in June became the largest central bank to impose a negative interest rate on deposits—meaning banks are paying to park their money with the ECB. The effort is designed to encourage banks to instead use that money to lend. When the ECB dropped those rates further in September, some banks started pushing those costs—or costs related to the rate cuts—onto customers.
Euro Stoxx nearly round-trips to its Broadening Wedge.
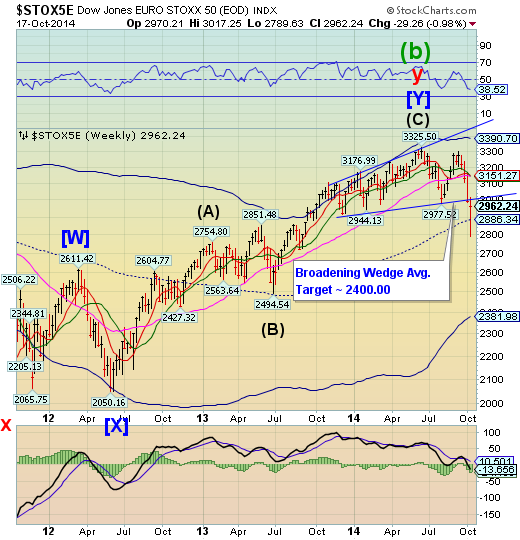
The EuroStoxx 50 Index fell through the trendline of its Broadening Wedge formation last week, beginning a panic decline before intervention came in late in the week. In all probability, EuroStoxx is likely to gain momentum to the downside this week. In addition, the Cycles Model suggests an important Cycle bottom may be occurring..
(Bloomberg) European stocks climbed the most in almost three years, ending their longest losing streak in 11 years, as an ailing euro-area economy increases pressure on policy makers to provide more stimulus measures.
The Stoxx Europe 600 Index jumped 2.8 percent to 318.68 at the close of trading, after a 7.7 percent slump in the past eight days dragged it to the lowest level of the year. Equities extended early gains after the European Central Bank’s Benoit Coeure said it will start buying assets within days. All 19 industry groups in the Stoxx 600 advanced, with automakers jumping as an industry association said car sales revived last month. Oil and gas companies rebounded from their lowest level in three years, while banks recovered from a one-year low.
The Yen is finding support inside its Bullish Wedge.
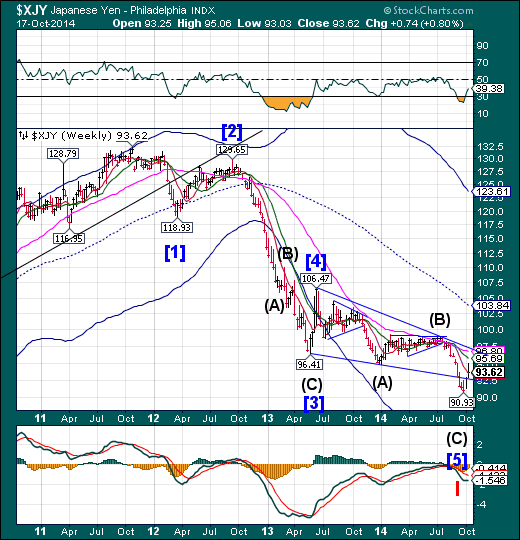
The Japanese yen has re-entered the Ending Diagonal formation after making its Master Cycle low two weeks ago, closing above weekly Short-term support at 93.50. This is a bullish reversal that may be further confirmed once it rises above the upper trendline. This will have the effect of drying up the Yen carry trade which has been a major source of funding for the equities markets.
(Reuters) - The yen edged down on Friday as comments from a Federal Reserve policymaker helped revive some appetite for risk, with investors focused on a speech later by Fed chief Janet Yellen.
European stocks, oil and peripheral euro zone bonds, rebounded after being hammered this week, while the safe-haven Japanese currency lost ground. The riskier Australian dollar gained 0.5 percent to trade at 93.58 yen.
The Nikkei 225 broke Long-term support.
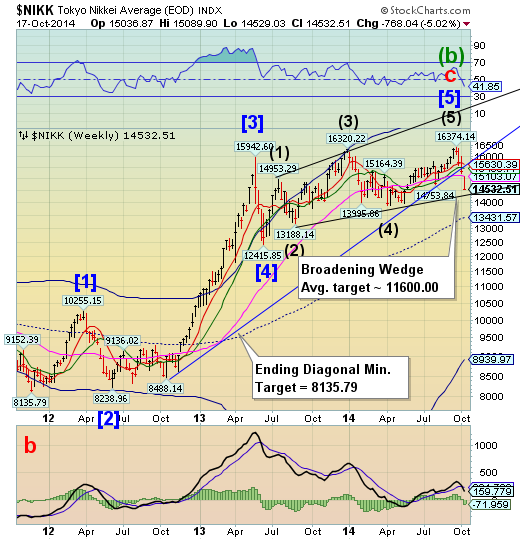
The Nikkei gapped down throughLong-term support at 15103.07 on Monday, threatening the lower trendline of its Broadening Wedge formation.A break beneath this level may be a double confirmation of the probable complete retracement of the rally that formed the Ending Diagonal over the past 3 years.A feedback loop may emerge between the declining Nikkei and the rising Yen as investors seek safe haven from the potential rout in stocks.
(Reuters) - Foreign investors continued tosell Japanese cash stocks last week, posting their biggest netselling in two months, as buyers shunned riskier assets amidfears of weakening global growth.
Foreigners, who were net sellers for the past two weeks,sold a total of 337.1 billion yen ($3.2 billion) worth of Japanese stocks during the week of Oct. 6-10, the biggest weekly selling since the first week of August, data from the Tokyo Stock Exchange showed on Friday.
US Dollar Index hovers above its Head & Shoulders neckline.
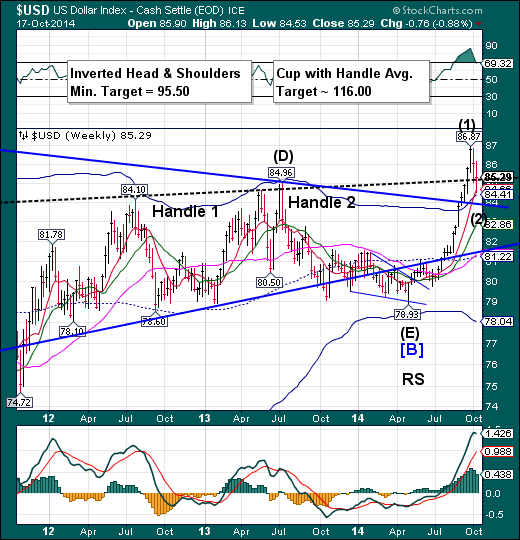
The US Dollar continues to hover at its Head &Shoulders neckline after breakingto new highs not seen since June of 2010.The Panic Rally may not yet be over as it is due for a panic high later this month. Panic buying may occur in an index when there is panic selling elsewhere.
(Reuters) - The U.S. dollar edged higher against a basket of major currencies on Friday after strong U.S. consumer sentiment data calmed nerves at the end of a week of severe market volatility.
The Thomson Reuters/University of Michigan preliminary October reading on the overall index on consumer sentiment unexpectedly rose to 86.4, the highest since July 2007.
The data eased concerns after worries surrounding the health of the global economy shook stocks, bonds and currencies markets this week. The dollar hit three-week lows against the euro and Swiss franc and a more than one-month low against the yen on Wednesday.
US 30 Year T-Bond leaves an Evening Doji Star.
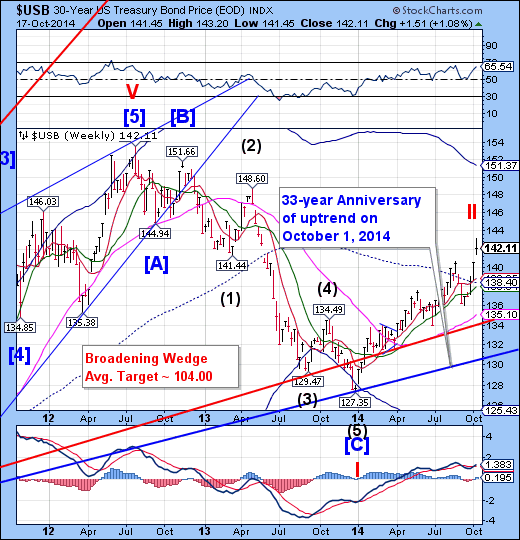
The Long Bond formed a rare Evening Doji Star week, which is highly unusual and a probable reversal signal.A weekly close beneath 140.00 next week would confirm the signal. Chances are now better-than even of an abrupt decline that may last several weeks in which USB may break its 33-year old trendline.The potential target may be weekly Cycle Bottom support at 125.43. The final Master Cycle low appears to be due in mid-November.
(WSJ) U.S. Treasury prices declined on Friday, as riskier assets found their footing after wild swings across financial markets in the past week.
In late-afternoon trading, benchmark 10-year notes fell 13/32 in price to yield 2.198%. The rate plummeted to 1.85% on Wednesday, as a shake-up in stocks fueled a sudden rally in safe-haven bonds.
Combined with Thursday’s price pullback, the selling on Friday managed to offset a large part of the dramatic mid-week rally, but still left the Treasurys market up for the fifth consecutive week, the longest streak since January. The 10-year note yielded 2.23% at the start of the week. Bond yields decline when prices rise.
Gold may have completed its bounce.
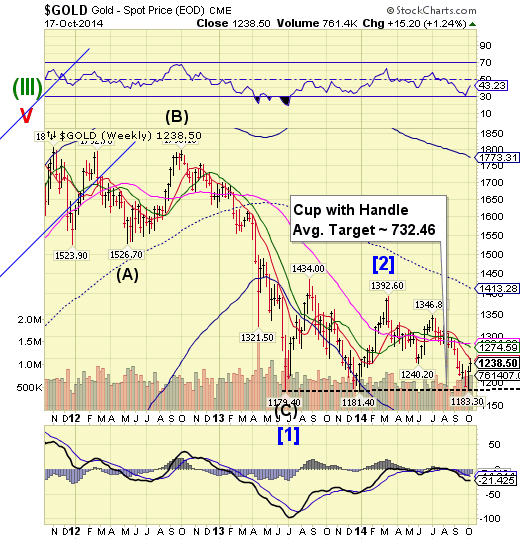
Gold may have completed its bounce at weekly short-term resistance at 1246.59 this week. Investors may be relieved that “The bottom is in,” but thebounce may turn into a Panic cycle decline with a low due in early November.
(WSJ) Gold prices fell Friday as a relief rally in U.S. equities sapped investor appetite for haven assets like precious metals.
The most actively traded contract, for December delivery, fell $2.20, or 0.2%, to $1,239 a troy ounce on the Comex division of the New York Mercantile Exchange.
U.S. equities marched higher, recovering from recent losses, as upbeat economic data revived the appeal of assets that benefit from U.S. growth. The S&P 500 index was recently up 22.97 points, or 1.2%, at 1885.73, while the Dow Jones Industrial Average rose 1.5% to 16361.70.
The decline in Crude Oil may not be over yet!
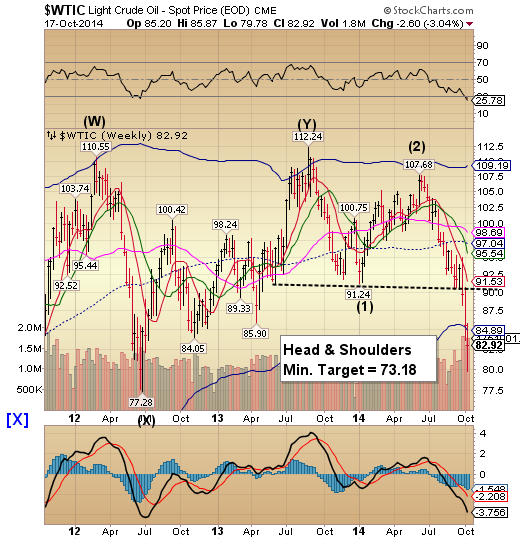
Crude may find its PanicCycle Bottom late next week.This week’s low at 79.78 may reflect probable support around 77.00 that appears to havesidetracked the decline. Crude is in a truly oversold condition and may be due for a sizeable bounce. But that may not deter it from the Head & Shoulders target at 73.18, however it intends to reach it. Frankly, I don’t think that the Saudis have anything to do with this decline.
On Tuesday, ZeroHedge commented, “Yesterday we lamented the ridiculously oversold levels in West Texas Intermediate, which as BofA calculated, has hit "oversold" levels for only the third time in six years. We assumed that this could be the basis for a short-term rebound. We were wrong, because we clearly had no idea just how determined the Saudis are to crush Putin into the ground courtesy of plunging oil prices.
As of moments ago, WTI has tumbled nearly $4, some 5%, to just over $81...”
China gives up the Cycle Top.
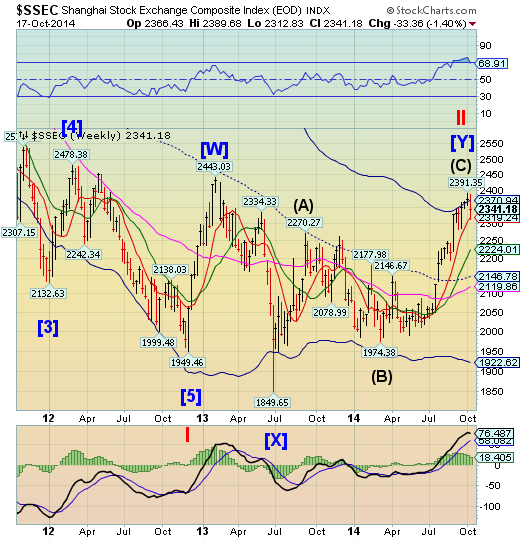
The Shanghai Composite gave up its Cycle Top at 2370.94 on its Primary Cycle high.It challenged its weekly Short-term support at 2319.24, but closed above it.The reversal may be awe-inspiring since the Model supports are so far apart. The ally may be due for a full retracement to the Cycle Bottom at 1922.62. Possible target dates begin the first week of November.
(ZeroHedge) Another month passes, and once again everyone gets a hearty laugh at China's endless promises to really start deleveraging for real, seriously this time, we promise... just not right now. Case in point, yesterday's report of new credit numbers which showed that in September new loans were CNY857.2bn, up from CNY702.5bn in August and well above consensus of CNY750bn. In fact, this was the highest amount of new loans for the month of September on record.
The Banking Index clearly breaks its Broadening Wedge.
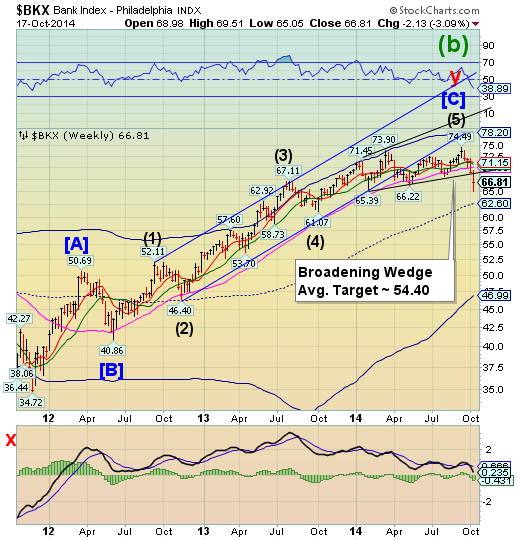
--KBW Bank broke down last week through the lower trendline of its Broadening Wedge. A weak bounce left BKX with one of the worst weeks in several years.The consequences of a violation ofthe Broadening Wedge trendline may bring on a panic decline that could last through late October or early November.
(ZeroHedge) Remember when banks said to ignore "one-time, non-recurring" legal fees because they are going away? Well, JPM yesterday showed they aren't. But it was Bank of America today which was slammed with the latest whopping $5.3 billion pretax litigation charge, which pushed its EPS once again into the red.
But wait, there's great news: the loss of $0.01 is really a $0.42 non-GAAP adjusted profit if one "adds back" the $0.43 in litigation charges.
Which is great for ostriches who like having their heads shoved in the sand. The only problem is that addbacks usually require charges to be one-time, non-recurring. Instead as the chart below shows Bank of America's litigation and legal charges are not only very much recurring, but as a cost of doing business, they keep increasing quarter after quarter:
(SovereignMan) For a casual observer of the US economy (most “experts”), you could say that things look pretty good. Unemployment is at its lowest rate in six years. Earnings of S&P 500 companies are higher than ever, while their debt is lower than it’s been in the last 24 years.
Nonetheless, rather than getting excited for good economic times, the big commercial banks are all battening down the hatches. They’re preparing for bad times ahead.I often stress the importance of being prepared, so in theory, that should be a great sign.
But then, you look at what they are “defensively” investing in, and you see that what they consider as prudence is simply insanity.What banks are stockpiling these days are US government bonds, and they’re not doing this casually, they’re going nuts for them.
(OfTwoMinds) The basic idea here is that central banks provide a buffer against financial crises.When short-term loans come due and the borrower has run out of cash, rather than slip into insolvency they can borrow short-term money from the central bank.
The ability to push down interest rates is helpful as a buffer when credit-tightening and fear of defaults push interest rates up enough to choke off normal lending.
What happened over the past six years is that central banks have moved from providing short-term buffers to being the saviors of the government, economy and asset markets. This is an extraordinary transformation, and it's the core reason why central bank policies are now failing to move the needle: they were designed to serve as short-term buffers during crisis and the resulting recession, not permanent props under government borrowing, the financial sector and the stock, bond and real estate markets.
