
Sprint Corp. (NYSE:S) reported impressive financial results for the second quarter of fiscal 2016. The company reported a year-over-year decline in loss which was also narrower than the Zacks Consensus Estimate. Meanwhile, revenues beat the Zacks Consensus Estimate.
This Zacks Rank #3 (Hold) stock faces fierce competition in the U.S. wireless market from the likes of Verizon Communications Inc. (NYSE:VZ) , AT&T Inc. (NYSE:T) and T-Mobile US Inc. (NYSE:T) . You can see the complete list of today’s Zacks #1 Rank (Strong Buy) stocks here.
Quarterly net loss was $142 million or 4 cents per share, much narrower than a net loss of $585 million or 15 cents per share in the year-ago quarter. Also, second-quarter adjusted net loss per share of 4 cents was narrower than the Zacks Consensus Estimate of a loss of 7 cents.
Quarterly total revenue came in at $8,247 million, up 3.4% year over year but ahead of the Zacks Consensus Estimate of $7,986 million. Service revenues were $6,413 million, down 1.6% while Equipment revenues totaled $1,834 million, up a substantial 67.5%.
Operating expenses were $7,625 million, down 4.4% year over year. Operating income was $622 million as against an operating loss of $2 million in the year-ago quarter. Adjusted EBITDA improved 16.9% year over year to $2,347 million. Adjusted EBITDA margin was 36.6% compared with 29.2% in the year-ago quarter.
Cash Flow
In the second quarter of fiscal 2016, Sprint generated $2,250 million of cash from operations compared with $1,797 million in the prior-year quarter. Quarterly adjusted free cash flow was $707 million as against a negative $100 million in the prior-year quarter.
Liquidity
At the end of the quarter under review, Sprint had $4,006 million of cash and marketable securities compared with $2,641 million at the end of fiscal 2015. Total long-term debt outstanding, at the end of the reported quarter, was $47,285 million compared with $45,233 million at the end of fiscal 2015. At first-quarter end, the debt-to-capitalization ratio was 58.5% versus 57.3% at the end of fiscal 2015.
Wireless Segment
Total segment revenue was $6,017 million, down 5% year over year. Postpaid revenues totaled $4,720 million, down 3.5%. Prepaid revenues were $1,129 million, down 10.3%. Wholesale revenues were $168 million, down 9.2%. Equipment revenues were $1,834 million, up 67.5% year over year.
Wireline Segment
Total segment revenue was $521 million, down 14.4% year over year. Voice revenues totaled $172 million, down 18.9%. Data revenues were $43 million, flat year over year. Internet revenues were $288 million, down 10.8%. Other revenues were $18 million, down 42% year over year.
Subscriber Statistics
In the reported quarter, Sprint gained 344,000 postpaid subscribers and 823,000 wholesale customers but lost 427,000 prepaid customers. As of Sep 30, 2016, Sprint had 60.193 million wireless customers, up 4% year over year. This includes 31.289 million postpaid, 13.547 million prepaid and 15.357 million wholesale customers.
Quarterly total retail postpaid churn rate was 1.52% compared with 1.54% in the year-ago quarter. Total retail prepaid churn rate was 5.63%, up from 5.06% in the prior-year quarter. Total retail postpaid ARPU (average revenue per user) was $50.54, down 6.4% year over year. Total retail prepaid ARPU was $27.31, down 1.3% year over year.
SPRINT CORP Price, Consensus and EPS Surprise
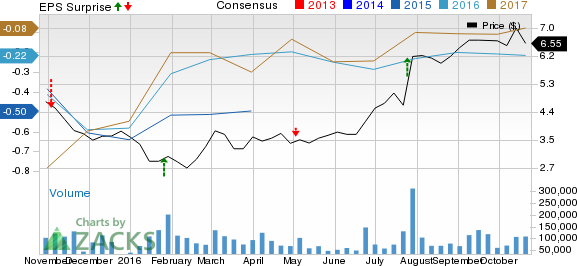
SPRINT CORP Price, Consensus and EPS Surprise | SPRINT CORP Quote
Outlook
Sprint raised its fiscal 2016 outlook. The company now expects fiscal 2016 operating income of $1.2 billion to $1.7 billion, above the previous range of $1 billion to $1.7 billion. Capital expenditures are expected to be less than the initial estimate of $3 billion. Adjusted free cash flow is projected at around a breakeven. Adjusted EBITDA projection is maintained in the range of $9.5 billion to $10 billion.
Confidential from Zacks
Beyond this Analyst Blog, would you like to see Zacks' best recommendations that are not available to the public? Our Executive VP, Steve Reitmeister, knows when key trades are about to be triggered and which of our experts has the hottest hand. Click to see them now>>
AT&T INC (T): Free Stock Analysis Report
SPRINT CORP (S): Free Stock Analysis Report
VERIZON COMM (VZ): Free Stock Analysis Report
T-MOBILE US INC (TMUS): Free Stock Analysis Report
Original post
Zacks Investment Research