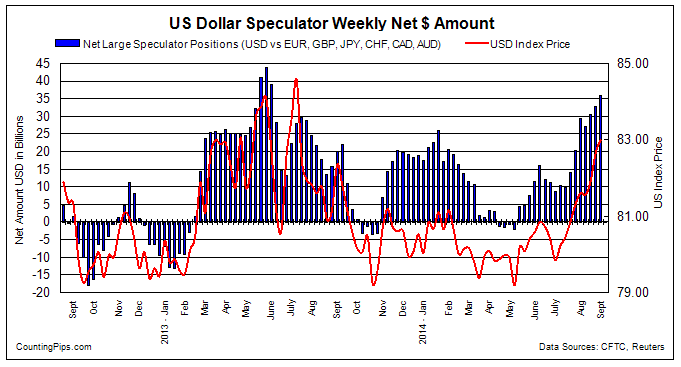
The latest data for the weekly Commitment of Traders (COT) report, released by the Commodity Futures Trading Commission (CFTC) on Friday, showed that large traders and forex speculators increased US Dollar bullish bets last week for a third straight week and to a new highest level since the middle of 2013.
Non-commercial large futures traders, including hedge funds and large speculators, had an overall US dollar long position totaling $35.88 billion as of Tuesday September 2nd, according to the latest data from the CFTC and dollar amount calculations by Reuters. This was a weekly change of +$2.96 billion from the $32.92 billion total long position that was registered on August 26th, according to the Reuters calculation that totals the US dollar contracts against the combined contracts of the euro, British pound, Japanese yen, Australian dollar, Canadian dollar and the Swiss franc.
The aggregate US dollar bullish position has risen for three consecutive weeks and for six out of the last seven weeks. The gain in the US dollar bullish position marks a new highest level since June 4th 2013 when speculators were long by $39.12 billion.
Overall Speculative Net Contracts
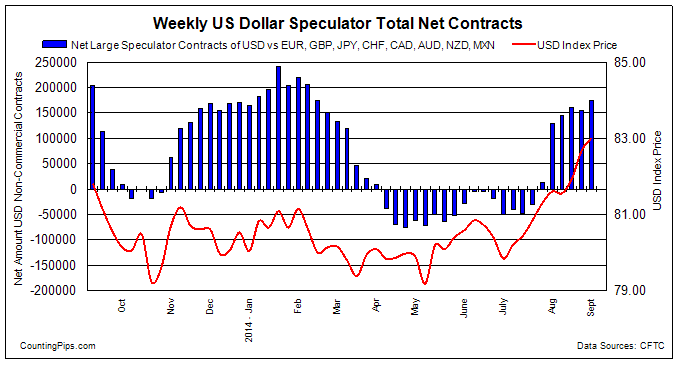
In terms of total speculative contracts, overall US dollar contracts advanced last week to +174,876 contracts as of Tuesday September 2nd. This was a change by +19,868 contracts from the total of +155,008 contracts as of Tuesday August 26th. This total US dollar contracts calculation takes into account more currencies than the Reuters dollar amount total and is derived by adding the sum of each individual currencies net position versus the dollar. Currency contracts used in the calculation are the euro, British pound, Japanese yen, Swiss franc, Canadian dollar, Australian dollar, New Zealand dollar and the Mexican peso.
Major Currency Weekly Levels & Changes:
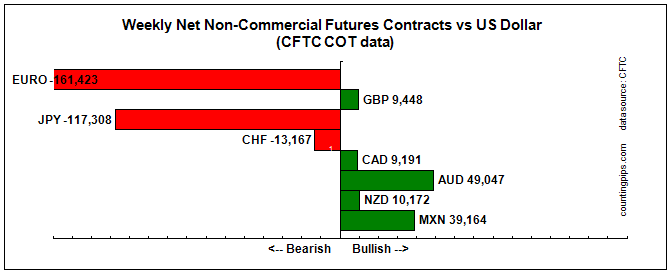
Overall changes on the week for the major currencies showed that large speculators raised their bets last week in favor of the Canadian dollar, Australian dollar and the Mexican peso while decreasing weekly bets for the euro, Japanese yen, British pound sterling, Swiss franc and the New Zealand dollar.
Notable changes on the week for the Major Currencies:
- Euro position bearishness continued again last week and euro contracts fell for the seventh out of the last eight weeks. The spec positions are now at the lowest level since July 17 2012 when positions equaled -167,249 contracts
- British pound sterling positions fell last week and marked the lowest bullish reading since January 21, 2013 when positions equaled +8,720 contracts
- Japanese yen bets fell rather sharply again last week (-14,417) and dropped for a third week. Yen bets have declined five out of the last six weeks and to the lowest level since January
- Swiss franc bets edged slightly lower last week after 3 weeks of rises. Franc positions have been on the bearish side now for eleven straight weeks
- Canadian dollar positions rose for the first time in five weeks as the USD/CAD exchange rate remains close to the major 1.1000 major level
- Australian dollar net positions continue to draw strong sentiment as positions rose for a 3rd week and to a new highest bullish level since April 2013. Unfortunately for Aussie bulls the AUDUSD pair has been in a tight holding pattern around the 0.9300 exchange rate for many weeks now
- New Zealand dollar net positions fell for a fifth straight week as the NZDUSD exchange rate slid to the 0.8300 level last week
- Mexican peso positions rose slightly last week to gain for a third week and to the highest level in six weeks. The peso spec positions dropped sharply and fell into bearish territory on August 12th before turning around and rebounding over the past few weeks
This latest COT data is through Tuesday September 2nd and shows a quick view of how large speculators and for-profit traders (non-commercials) were positioned in the futures markets. All currency positions are in direct relation to the US dollar where, for example, a bet for the euro is a bet that the euro will rise versus the dollar while a bet against the euro will be a bet that the dollar will gain versus the euro.
Please see the individual currency charts and their respective data points below.
Weekly Charts: Large Speculators Weekly Positions vs Currency Spot Price
EuroFX:
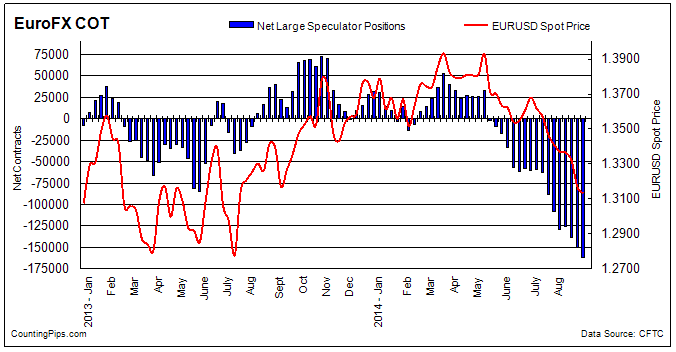
Last Six Weeks data for EuroFX futures
| Date | Open Interest | Long Specs | Short Specs | Large Specs Net | Weekly Change |
| 07/29/2014 | 356865 | 56562 | 164637 | -108075 | -19252 |
| 08/05/2014 | 379004 | 55179 | 183926 | -128747 | -20672 |
| 08/12/2014 | 376424 | 51596 | 177613 | -126017 | 2730 |
| 08/19/2014 | 396460 | 56774 | 195599 | -138825 | -12808 |
| 08/26/2014 | 402709 | 53989 | 204646 | -150657 | -11832 |
| 09/02/2014 | 419850 | 59398 | 220821 | -161423 | -10766 |
British Pound Sterling:
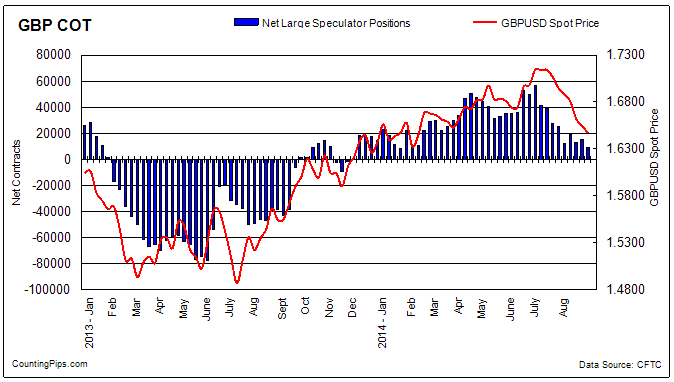
Last Six Weeks data for Pound Sterling futures
| Date | Open Interest | Long Specs | Short Specs | Large Specs Net | Weekly Change |
| 07/29/2014 | 237411 | 75370 | 50460 | 24910 | -2587 |
| 08/05/2014 | 230801 | 66437 | 54316 | 12121 | -12789 |
| 08/12/2014 | 223719 | 65348 | 46549 | 18799 | 6678 |
| 08/19/2014 | 237291 | 72230 | 58943 | 13287 | -5512 |
| 08/26/2014 | 233435 | 71002 | 55535 | 15467 | 2180 |
| 09/02/2014 | 238973 | 67538 | 58090 | 9448 | -6019 |
Japanese Yen:
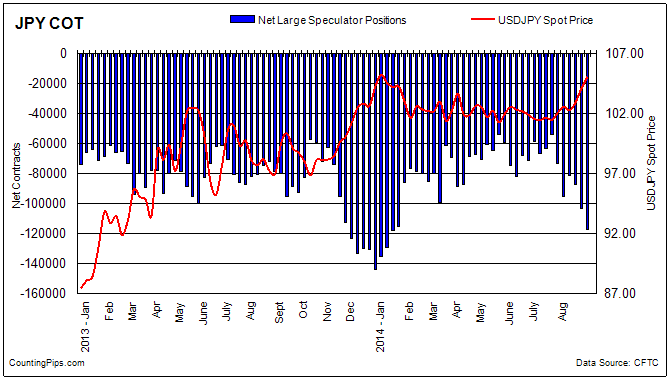
Last Six Weeks data for Yen Futures
| Date | Open Interest | Long Specs | Short Specs | Large Specs Net | Weekly Change |
| 07/29/2014 | 172210 | 7828 | 80897 | -73069 | -19153 |
| 08/05/2014 | 192906 | 9896 | 105295 | -95399 | -22330 |
| 08/12/2014 | 192140 | 12518 | 93615 | -81097 | 14302 |
| 08/19/2014 | 203180 | 17976 | 105247 | -87271 | -6174 |
| 08/26/2014 | 218009 | 19512 | 122403 | -102891 | -15620 |
| 09/02/2014 | 230937 | 15485 | 132793 | -117308 | -14417 |
Swiss Franc:
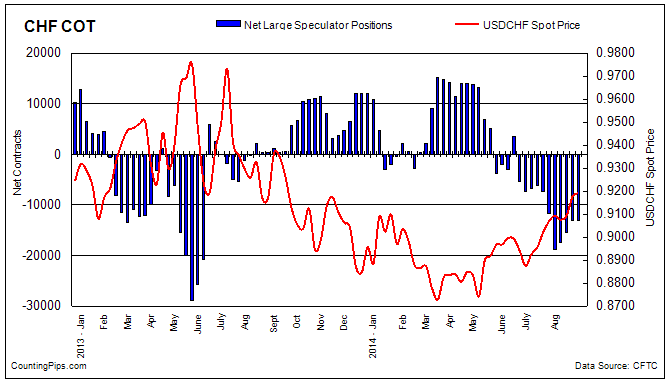
Last Six Weeks data for Franc futures
| Date | Open Interest | Long Specs | Short Specs | Large Specs Net | Weekly Change |
| 07/29/2014 | 44022 | 8665 | 20429 | -11764 | -4384 |
| 08/05/2014 | 57238 | 9247 | 28100 | -18853 | -7089 |
| 08/12/2014 | 51981 | 5247 | 22606 | -17359 | 1494 |
| 08/19/2014 | 50414 | 6174 | 21666 | -15492 | 1867 |
| 08/26/2014 | 53761 | 7466 | 20505 | -13039 | 2453 |
| 09/02/2014 | 60436 | 9166 | 22333 | -13167 | -128 |
Canadian Dollar:
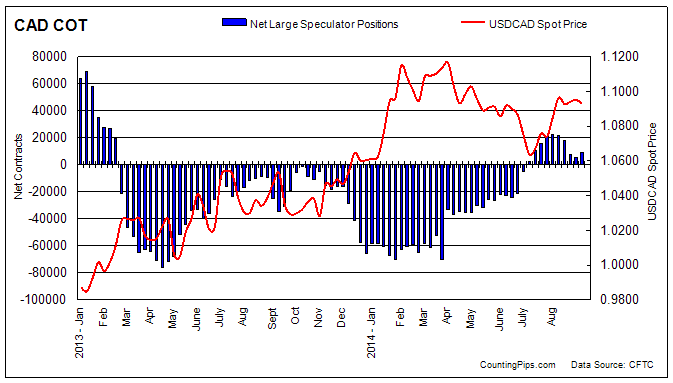
Last Six Weeks data for Canadian dollar futures
| Date | Open Interest | Long Specs | Short Specs | Large Specs Net | Weekly Change |
| 07/29/2014 | 122619 | 56459 | 33768 | 22691 | 2110 |
| 08/05/2014 | 115261 | 48944 | 27489 | 21455 | -1236 |
| 08/12/2014 | 108979 | 44053 | 26055 | 17998 | -3457 |
| 08/19/2014 | 113301 | 41844 | 34563 | 7281 | -10717 |
| 08/26/2014 | 108441 | 38522 | 32859 | 5663 | -1618 |
| 09/02/2014 | 105984 | 35333 | 26142 | 9191 | 3528 |
Australian Dollar:
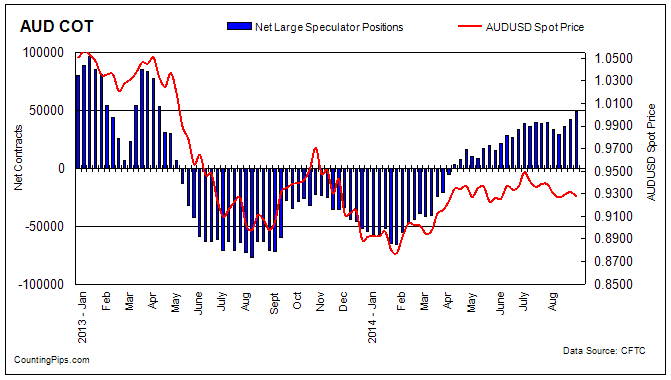
Last Six Weeks data for Australian dollar futures
| Date | Open Interest | Long Specs | Short Specs | Large Specs Net | Weekly Change |
| 07/29/2014 | 106836 | 69348 | 29742 | 39606 | 813 |
| 08/05/2014 | 98196 | 60860 | 27560 | 33300 | -6306 |
| 08/12/2014 | 94030 | 54691 | 25145 | 29546 | -3754 |
| 08/19/2014 | 103432 | 65747 | 29173 | 36574 | 7028 |
| 08/26/2014 | 107819 | 71658 | 29720 | 41938 | 5364 |
| 09/02/2014 | 114146 | 77050 | 28003 | 49047 | 7109 |
New Zealand Dollar:
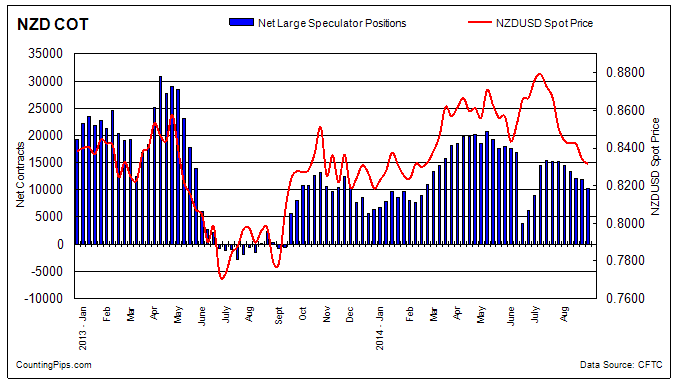
Last Six Weeks data for New Zealand dollar futures
| Date | Open Interest | Long Specs | Short Specs | Large Specs Net | Weekly Change |
| 07/29/2014 | 30531 | 23552 | 8263 | 15289 | 157 |
| 08/05/2014 | 25603 | 18949 | 4449 | 14500 | -789 |
| 08/12/2014 | 25214 | 17913 | 4484 | 13429 | -1071 |
| 08/19/2014 | 24048 | 16796 | 4764 | 12032 | -1397 |
| 08/26/2014 | 23619 | 16405 | 4564 | 11841 | -191 |
| 09/02/2014 | 23319 | 15623 | 5451 | 10172 | -1669 |
Mexican Peso:
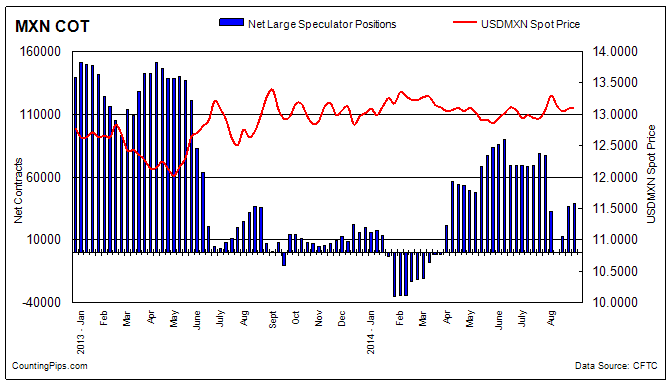
Last Six Weeks data for Mexican Peso futures
| Date | Open Interest | Long Specs | Short Specs | Large Specs Net | Weekly Change |
| 07/29/2014 | 145184 | 100551 | 23436 | 77115 | -2019 |
| 08/05/2014 | 143236 | 77535 | 45102 | 32433 | -44682 |
| 08/12/2014 | 154694 | 51933 | 51974 | -41 | -32474 |
| 08/19/2014 | 141175 | 56207 | 43800 | 12407 | 12448 |
| 08/26/2014 | 141665 | 71680 | 35010 | 36670 | 24263 |
| 09/02/2014 | 144255 | 75444 | 36280 | 39164 | 2494 |
