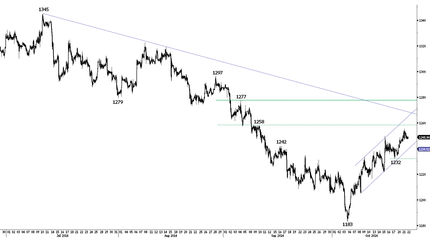
The net long non-commercial futures on Gold increased more than 20'000 contracts on the week to October 14th. The rebound from $1,180 support has clearly been a trigger for short-term correction. In addition speculators seemingly relied on lower US yields and higher physical demand to increase long gold positions in their portfolios.
The extension of USD weakness and lower US yields should continue supporting the short-term bullish trend. The 40-day rolling correlation between XAU and U.S. 10-Year yields exceeds 50%, which is a strong sign of a risk-off environment. The U.S.10-year pays no more than 2.17% given the uncertainties on the timing of the first Fed fund rate hike. In this configuration, we see deeper upside correction in gold prices, mostly due to safe haven inflows. In addition to safety, Chinese and Indian festive periods should keep the physical demand prominent in the coming months.
XAU/USD tested $1,245/1,251. Given the strengthening bullish momentum, a breakout should open the path towards $1,283/$1,300 (Fib 61.8% on July-October sell-off / psychological level). The SPDR gold holdings remains at five year lows, while the SPDR Gold Trust (ARCA:GLD), the world's largest gold ETF, nears $200 for the first time since September 10th.
Soft US inflation positive for gold
Today, the US releases the September CPI figures and the expectations are soft. The headline CPI y/y is expected to slow down to 1.6% from 1.7% y/y a month ago; the core CPI should remain stable at 1.7% y/y. The moderate improvement in wage growth combined to raise US household savings will perhaps keep consumer prices subdued for some more time. The PCE y/y – closely monitored by Fed – printed 1.5% in August. The next release is due on October 31st and will perhaps remain quite far from the Fed’s 2.0% target. Soft price pressures offer a net flexibility to the Fed on the timing of the first FF rate hike. Therefore, the downside pressures in U.S. 10-year should continue, giving the expected support to gold markets.
Swissquote SQORE Trade Idea:
G10 Currency Trend Model: Sell AUDUSD at 1.8817

Today's Key Issues (time in GMT)
2014-10-22T07:00:00 DKK Sep Retail Sales YoY, last 1.10%
2014-10-22T08:30:00 GBP Bank of England Publishes Minutes of Monetary Policy Meeting
2014-10-22T11:00:00 USD 17.Oct. MBA Mortgage Applications, last 5.60%
2014-10-22T12:30:00 USD Sep CPI MoM, exp 0.00%, last -0.20%
2014-10-22T12:30:00 USD Sep CPI YoY, exp 1.60%, last 1.70%
2014-10-22T12:30:00 USD Sep CPI Index NSA, exp 238.03, last 237.852
2014-10-22T12:30:00 USD Sep CPI Ex Food and Energy MoM, exp 0.10%, last 0.00%
2014-10-22T12:30:00 USD Sep CPI Ex Food and Energy YoY, exp 1.70%, last 1.70%
2014-10-22T12:30:00 USD Sep CPI Core Index SA, exp 238.625, last 238.345
2014-10-22T12:30:00 CAD Aug Retail Sales MoM, exp 0.00%, last -0.10%
2014-10-22T12:30:00 CAD Aug Retail Sales Ex Auto MoM, exp 0.20%, last -0.60%
2014-10-22T14:00:00 CAD 22.oct. Bank of Canada Rate Decision, exp 1.00%, last 1.00%
2014-10-22T21:45:00 NZD 3Q CPI QoQ, exp 0.50%, last 0.30%
2014-10-22T21:45:00 NZD 3Q CPI YoY, exp 1.20%, last 1.60%
The Risks Today
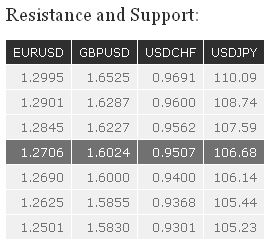
EURUSD: EUR/USD has weakened near the hourly resistance at 1.2901. The hourly support at 1.2706 (see also the rising channel) is challenged. Another hourly support can be found at 1.2625 (15/10/2014 low), while a key support stands at 1.2501. An hourly resistance lies at 1.2845 (16/10/2014 high). In the longer term, EUR/USD is in a downtrend since May 2014. The break of the strong support area between 1.2755 (09/07/2013 low) and 1.2662 (13/11/2012 low) has opened the way for a decline towards the strong support at 1.2043 (24/07/2012 low). As a result, the recent strength in EUR/USD is seen as a countertrend move. A key resistance stands at 1.2995 (16/09/2014 high). Given yesterday's move, we need to work on a new short strategy.
GBPUSD: GBP/USD has bounced sharply near the key support at 1.5855. However, prices have thus far failed to invalidate their succession of lower highs. As a result, monitor the resistance at 1.6227. Hourly supports lie at 1.6030 (17/10/2014 low) and 1.5942 (16/10/2014 low). Another resistance stands at 1.6287. In the longer term, the collapse in prices after having reached 4-year highs has created a strong resistance at 1.7192, which is unlikely to be broken in the coming months. Despite the recent short-term bearish momentum, we favour a temporary rebound near the support at 1.5855 (12/11/2013 low). A key resistance lies at 1.6525.
USDJPY: USD/JPY has weakened near the resistance at 107.59 (see also the 50% retracement). However, yesterday's large lower shadow indicates strong short-term buying interest. An hourly support can be found at 106.14 (17/10/2014 low). Another resistance lies at 108.74. A long-term bullish bias is favoured as long as the key support 100.76 (04/02/2014 low) holds. Despite the recent decline near the major resistance at 110.66 (15/08/2008 high), a gradual move higher is eventually favoured. Another resistance can be found at 114.66 (27/12/2007 high). A key support lies at 105.44 (02/01/2014 high).
USDCHF: USD/CHF continues to improve since 15 October. The short-term declining trendline has been broken and the resistance at 0.9491 has been breached. Another resistance stands at 0.9562. An hourly support lies at 0.9441 (intraday low), while a more significant support is at 0.9368. From a longer term perspective, the technical structure favours a full retracement of the large corrective phase that started in July 2012. As a result, the recent weakness is seen as a countertrend move. A key support can be found at 0.9301 (16/09/2014 low). A resistance now lies at 0.9691 (06/10/2014 high).

