Get 40% Off
⚠ Earnings Alert! Which stocks are poised to surge?
See the stocks on our ProPicks radar. These strategies gained 19.7% year-to-date.
Unlock full list

Soybean Oil's Perfect Pattern

Published 11/29/2016, 11:43 AM
Updated 07/09/2023, 06:31 AM

The weekly soybean oil continuation graph has completed one of the most perfect textbook head-and-shoulder bottom patterns I have seen in 41 years following the futures markets.
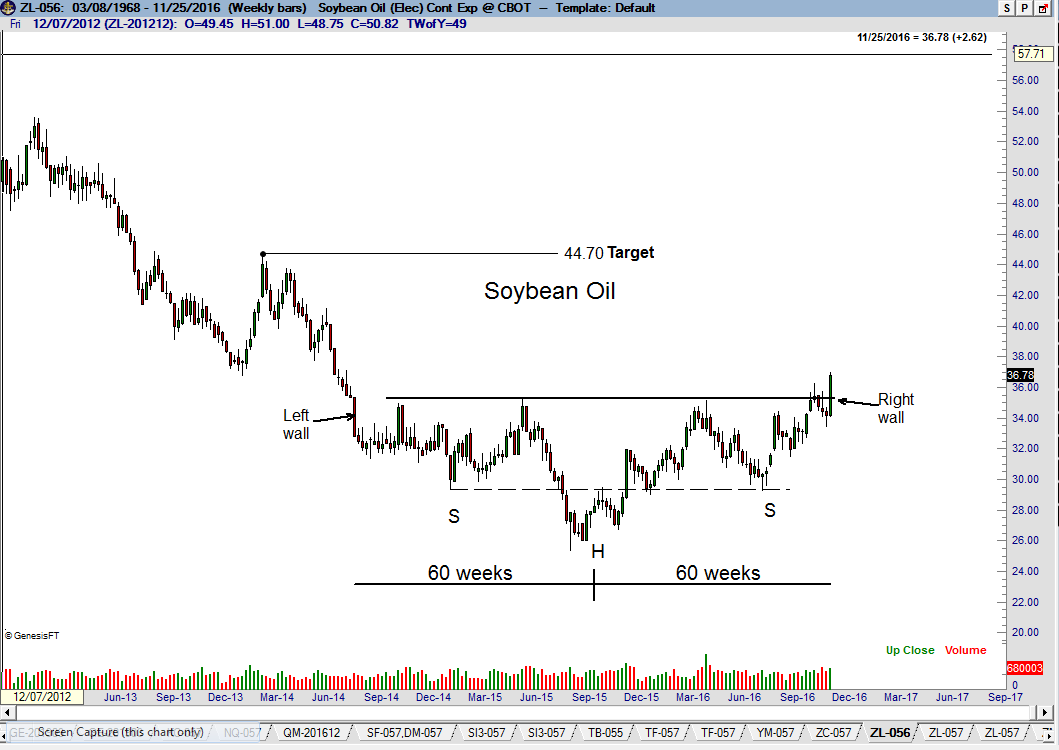
Weekly Soybean Oil

A perfect H&S bottom pattern contains the following elements:

  • H&S is undeniable in its identification
    • Not only is the 27-month H&S on the soybean oil graph undeniable, but the WBB decline in mid Aug 2014 along with the WBB advance this past week represent rare “pattern walls.” In other words, these WBBs clearly demarcate the pattern from all other price.
  • Flat or slightly up-slanted neckline
    • The neckline is horizontal. The orthodox highs of the left shoulder and right shoulder are only 15 ticks different.
  • Symmetry in height between the elements
    • The left shoulder and right shoulder lows are almost identical (dashed line) – only four ticks.
  • Symmetry in time between the elements
    • The length between the WBB left-wall in Aug 2014 to the mid- point of the head in mid Oct 2015 is 60 weeks. The length between the mid-point of the head in mid Oct 2015 to this past week’s WBB right-wall breakout is 60 weeks.
  • A decisive pattern completion
    • The breakout on Wednesday occurred with a powerful 262 point.

Factor is long and I am interested in increasing leverage if the market can dip back to the 36.11 level (Mar. contract). The soybean oil target is 44.50 to 45.00. If such a dip occurs, the risk on the entire trade will be 130 BPs. My potential gain is 900 to 1,000.
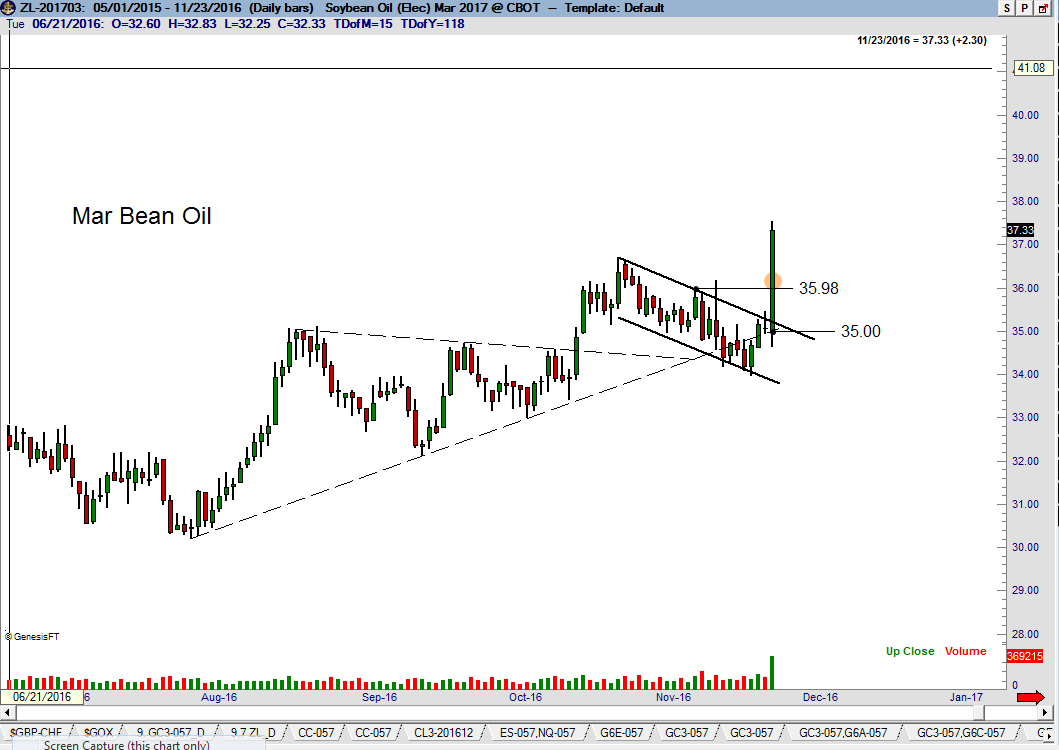

Daily Soybean Oil

Latest comments

Where is the stop?
Risk Disclosure: Trading in financial instruments and/or cryptocurrencies involves high risks including the risk of losing some, or all, of your investment amount, and may not be suitable for all investors. Prices of cryptocurrencies are extremely volatile and may be affected by external factors such as financial, regulatory or political events. Trading on margin increases the financial risks.
Before deciding to trade in financial instrument or cryptocurrencies you should be fully informed of the risks and costs associated with trading the financial markets, carefully consider your investment objectives, level of experience, and risk appetite, and seek professional advice where needed.
Fusion Media would like to remind you that the data contained in this website is not necessarily real-time nor accurate. The data and prices on the website are not necessarily provided by any market or exchange, but may be provided by market makers, and so prices may not be accurate and may differ from the actual price at any given market, meaning prices are indicative and not appropriate for trading purposes. Fusion Media and any provider of the data contained in this website will not accept liability for any loss or damage as a result of your trading, or your reliance on the information contained within this website.
It is prohibited to use, store, reproduce, display, modify, transmit or distribute the data contained in this website without the explicit prior written permission of Fusion Media and/or the data provider. All intellectual property rights are reserved by the providers and/or the exchange providing the data contained in this website.
Fusion Media may be compensated by the advertisers that appear on the website, based on your interaction with the advertisements or advertisers.
© 2007-2024 - Fusion Media Limited. All Rights Reserved.