• SNB’s Jordan repeats that CHF is overvalued Swiss National Bank Chairman Thomas Jordan said in an interview that CHF remains overvalued, reaffirming the Bank’s readiness to intervene in the markets if it becomes necessary. He said that there is no limit on the size of SNB’s balance sheet and that the current negative interest rates “have worked very well.” Even though CHF has weakened significantly against USD and GBP, to reach levels before the 15th of January event, with less than a week ahead of the ECB’s policy meeting, the likelihood for another “surprise” by the SNB is high. Expectations for further easing by the ECB have increased recently, as such, the SNB could cut rates further into the negative territory to weaken CHF against the EUR.
• Overnight, the Australian private capital expenditure fell much steeper than expected in Q3. The figure continued to contract, declining for the fourth straight quarter. This suggests that the rebalance from the mining sector remains challenging for the nation. Added to the sluggish growth in China and the falling iron ore prices, it makes it more likely that the RBA will have to cut rates again. However, given the recent comments by the RBA Governor Glenn Stevens that the markets should “chill out” on prospects for another rate cut, I don’t expect the Bank to act at its next week meeting. The Australian dollar tumbled against USD, but I still expect the currency to continue strengthening against its New Zealand counterpart due to prospects that the Reserve Bank of New Zealand will cut interest rates next month.
• Today’s highlights: During the European day, Eurozone’s M3 money supply for October is forecast to have risen at the same pace as in September. If the forecast is met, the 3-month moving average is expected to have slowed slightly. While this figure is not a major market mover, it could give an extra sign that the ECB should do more to boost liquidity into its financial system in order to achieve price stability. Germany’s Gfk consumer confidence index for December is also coming out.
• The US financial markets will be closed for the Thanksgiving Day holiday. As a result, we could see increased volatility due to the thin liquidity.
• We have no speakers on Thursday’s agenda.
The Market
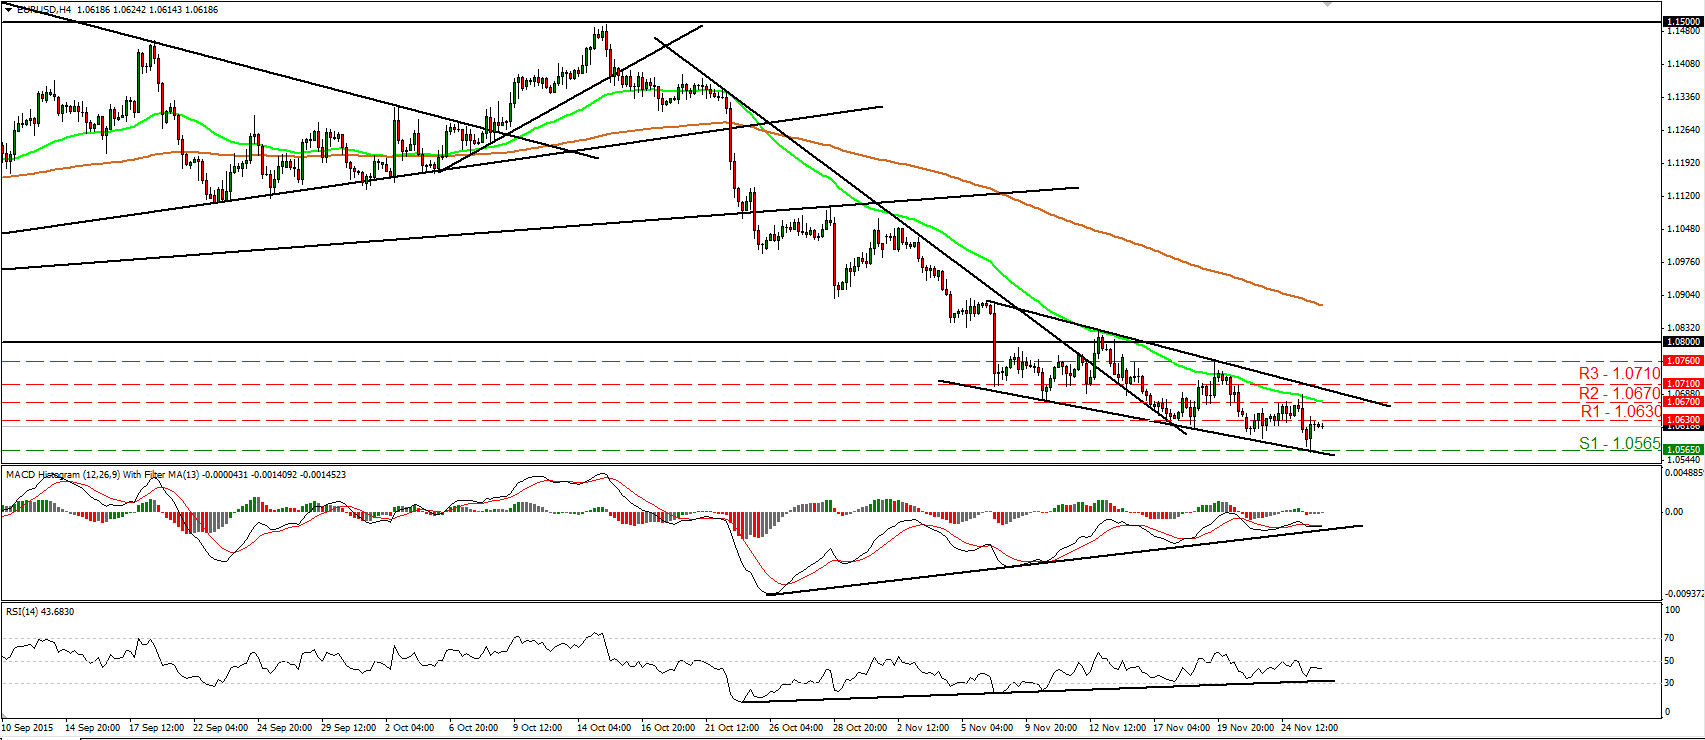
EUR/USD tumbles and hits support at 1.0565
• EUR/USD tumbled yesterday after it hit resistance slightly above the 1.0670 (R2) resistance line. However, the decline was stopped by the 1.0565 (S1) level and then the rate rebounded to trade back above 1.0600, fractionally below 1.0630 (R1). The short-term trend remains negative in my view and therefore, I would expect a clear move below 1.0565 (S1) to open the way for the next support of 1.0530 (S2), defined by the lows of the 13th and 14th of April. Looking at our momentum studies though, I see signs that the current rebound may continue a bit more. The RSI rebounded from slightly above its upside support line and could now be headed towards its 50 line, while the MACD, although negative, shows signs of bottoming above its own support line. What is more, there is still positive divergence between both these indicators and the price action. In the bigger picture, as long as the pair is trading below 1.0800, the lower bound of the range it had been trading since the last days of April, I would consider the longer-term outlook to stay negative. I would treat any possible near-term advances that stay limited below 1.0800 as a corrective phase.
• Support: 1.0565 (S1), 1.0530 (S2), 1.0500 (S3)
• Resistance: 1.0630 (R1), 1.0670 (R2), 1.0710 (R3)
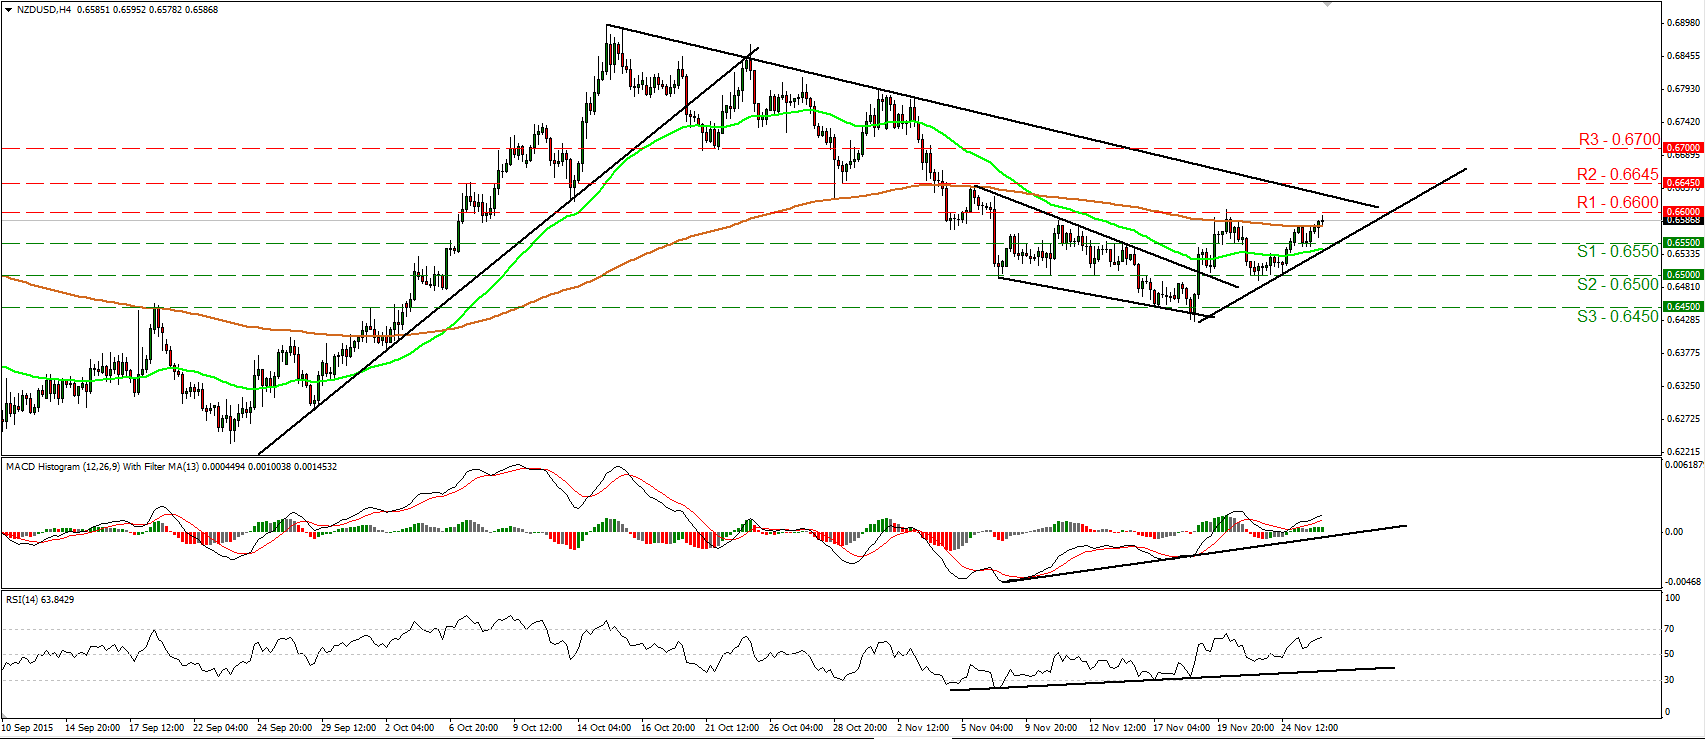
NZD/USD rebounds from 0.6550
• NZD/USD traded higher on Wednesday after it hit support marginally below the 0.6550 (S1) support line. Today during the early European morning, the rate looks to be headed towards the 0.6600 (R1) resistance line, where an upside break could challenge the downside resistance line taken from the peak of the 15th of October, or the next resistance of 0.6645 (R2). Our short-term oscillators reveal upside speed and support somewhat the notion. The RSI edged higher and could now be headed towards its 70 line, while the MACD stands above both its zero and trigger lines, pointing north. As for the broader trend, the decline started on the 15th of October makes me believe that the 23rd of September – 15th of October advance was just a corrective phase of the prevailing long-term downtrend. However, taking into account the recovery started on the 18th of November, I would keep a “wait and see” stance as far as the overall outlook is concerned.
• Support: 0.6550 (S1), 0.6500 (S2), 0.6450 (S3)
• Resistance: 0.6600 (R1), 0.6645 (R2), 0.6700 (R3)
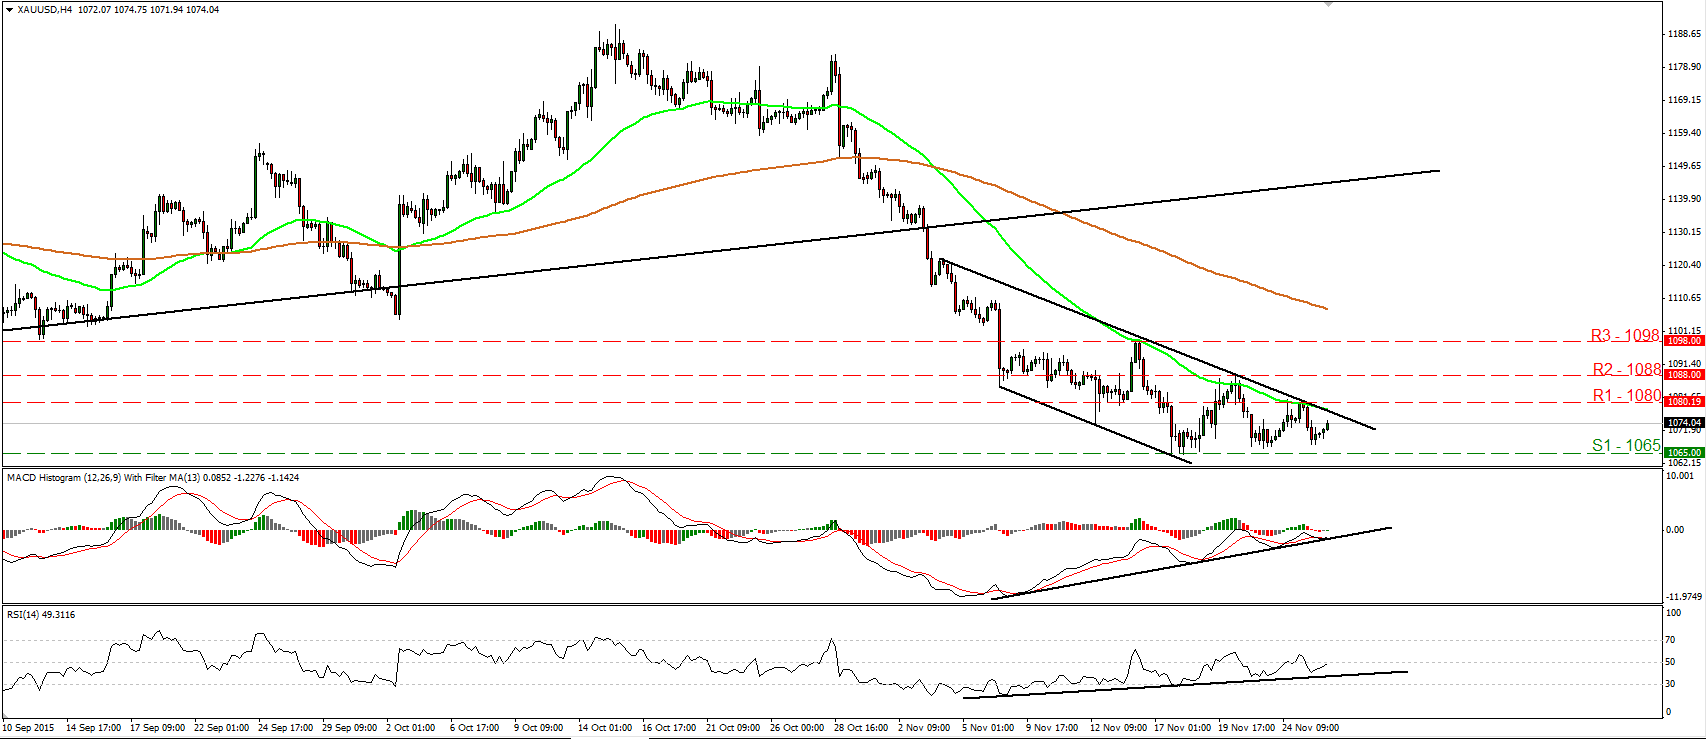
Gold rebounds again from slightly above 1065
• Gold slid yesterday, but rebounded after it hit support once again slightly above the 1065 (S1) support zone. The metal remains within the channel that has been containing the price action since the 4th of November, and this keeps the short-term technical picture negative. However, I see signs that the price could emerge above the upper bound of that channel, and even above the 1080 (R1) resistance zone. The RSI rebounded from slightly above its upside support line, while the MACD, although negative, shows signs of bottoming near its own support line and could move above its trigger line soon. Also, there is still positive divergence between both these studies and the price action. On the daily chart, I see that the plunge below the upside support line taken from the low of the 20th of July has shifted the medium-term outlook to the downside. As a result, I believe that the metal is poised to continue its down road in the foreseeable future and I would consider any possible near-term advances as a corrective phase for now.
• Support: 1065 (S1), 1055 (S2), 1050 (S3)
• Resistance: 1080 (R1), 1088 (R2), 1098 (R3)
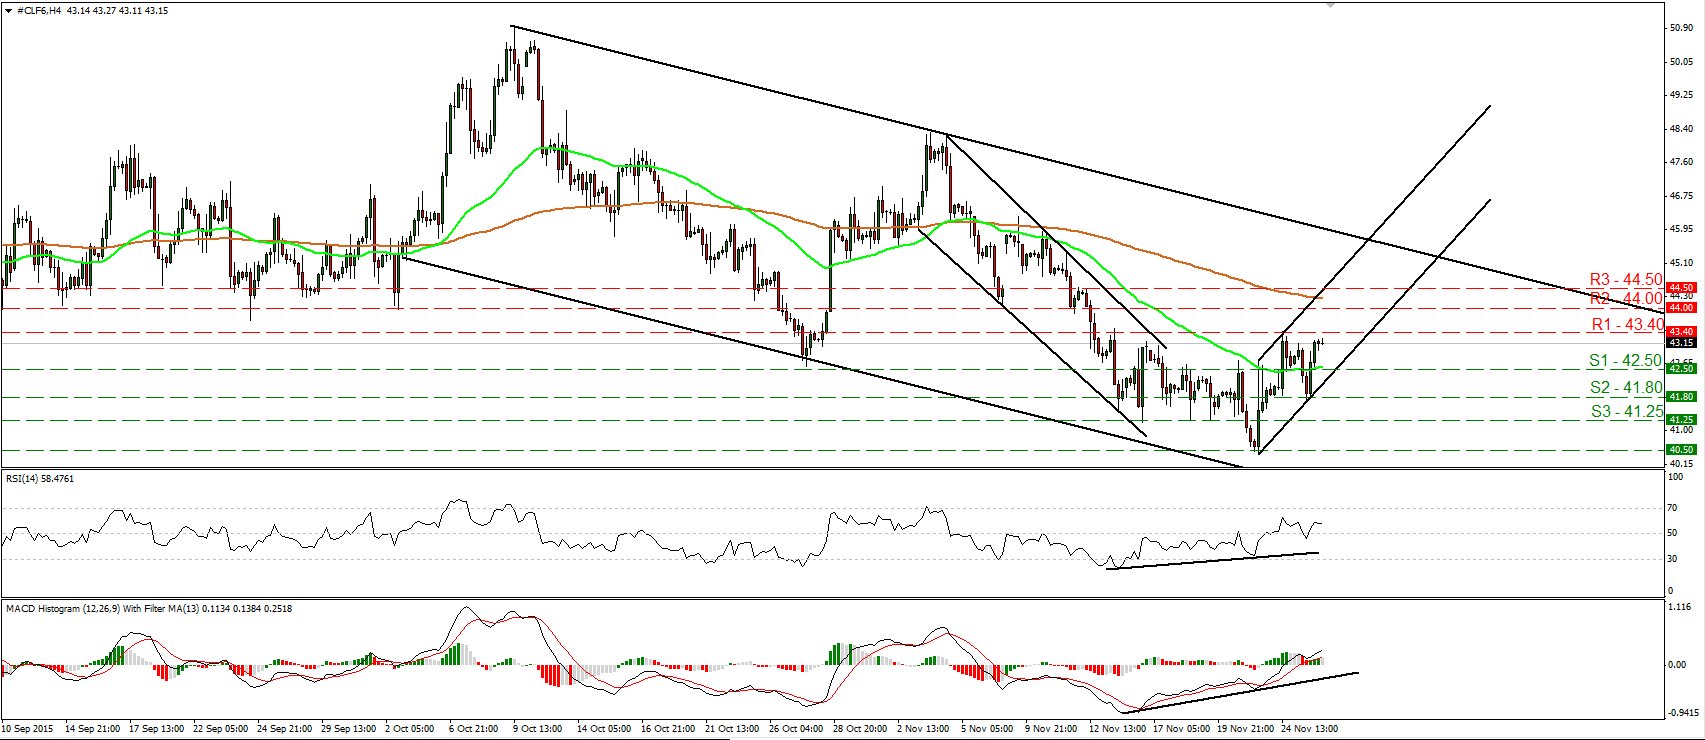
WTI rebounds from near 41.80
• WTI traded higher yesterday as data showed that US oil supplies rose by less than expected last week. The price rebounded from the 41.80 (S2) support barrier and now looks ready to challenge the resistance barrier of 43.40 (R1). A clear move above that hurdle is likely to confirm a forthcoming higher high on the 4-hour chart and perhaps challenge the 44.00 (R2) zone. Our short-term oscillators have now turned positive and support that WTI could continue trading higher for a while. The RSI rebounded from slightly below its 50 line, while the MACD stands above both its zero and trigger lines, pointing up. On the daily chart, WTI has been printing lower peaks and lower troughs within a downside channel since the 9th of October. Therefore, I would consider the medium-term outlook to be negative as well and I would treat any further near-term advances as a corrective move of that down path.
• Support: 42.50 (S1), 41.80 (S2), 41.25 (S3)
• Resistance: 43.40 (R1), 44.00 (R2), 44.50 (R3)
GBP/JPY breaks back above 185.00
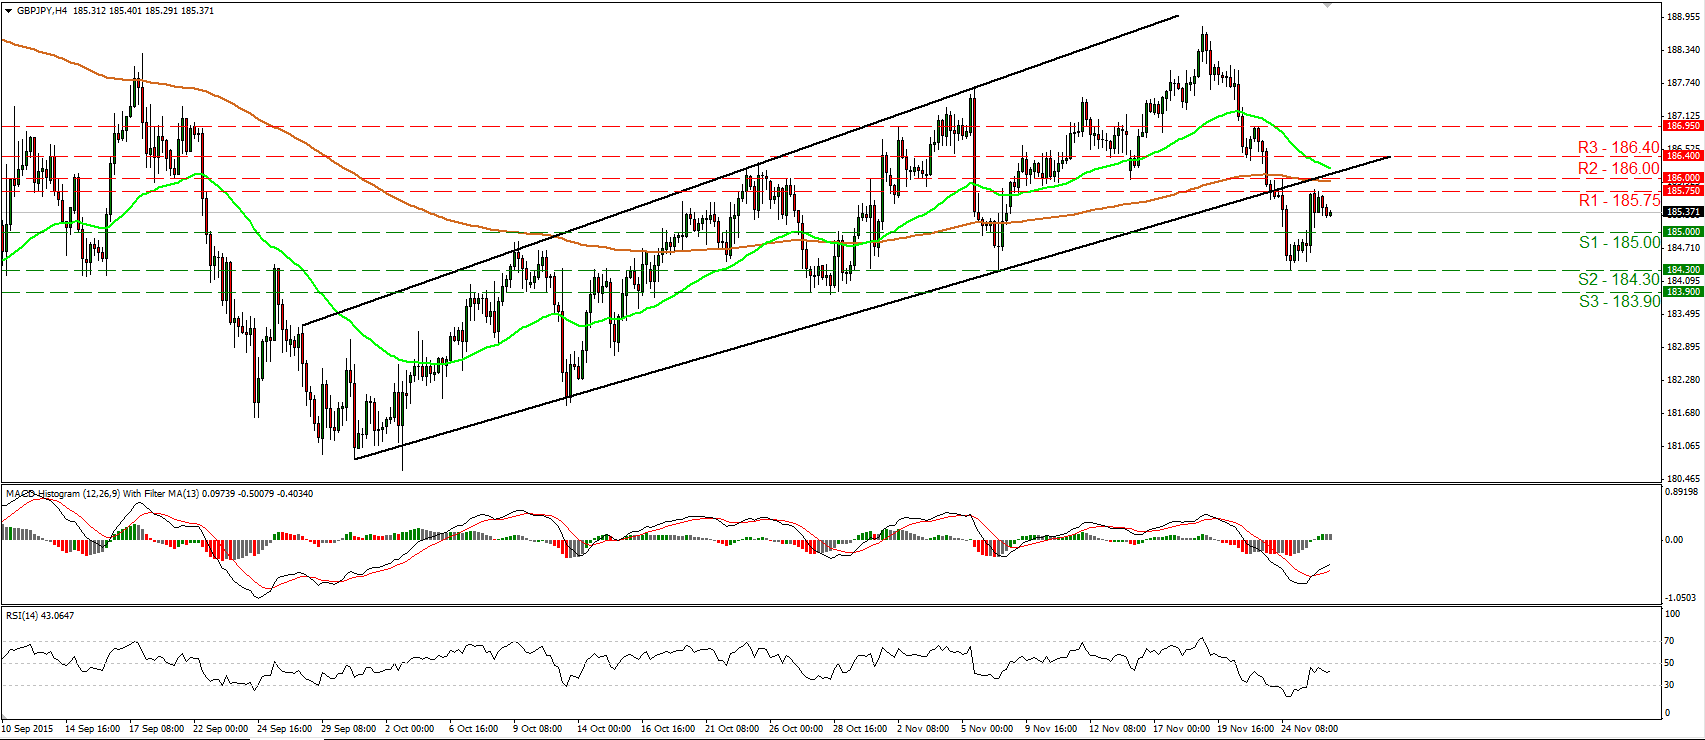
• GBP/JPY traded higher on Wednesday, breaking back above the psychological zone of 185.00 (S1). However, the rally was stopped slightly below the prior uptrend line taken from the low of the 30th of September. This keeps the short-term outlook negative in my view and I would expect the bears to regain control at some point. Another dip below the 185.00 (S1) zone is likely to open the way for another test at the 184.30 (S2) hurdle, defined by the lows of the 6th and 24th of November. Taking a look at our short-term oscillators though, I see the possibility for the rebound to continue for a while before sellers decide to take in charge again. The RSI turned up again and could make an attempt to move above its 50 line, while the MACD, although negative, has bottomed and crossed above its trigger line. On the daily chart, Monday’s break below the uptrend line taken from the low of the 30th of September make me adopt a flat stance as far as the longer-term picture is concerned.
• Support: 185.00 (S1), 184.30 (S2), 183.90 (S3)
• Resistance: 185.75 (R1), 186.00 (R2), 186.40 (R3)

