
Snap-on Incorporated (NYSE:SNA) added yet another earnings beat to its long-standing winning streak, as it reported third-quarter 2016 net earnings of $2.22 per share. Earnings surpassed the Zacks Consensus Estimate of $2.15 by 3.3%. The bottom line also reflected an increase of 12.1% compared with the year-ago figure of $1.98.
The bottom line benefited from organic top-line growth as well as lower operating and corporate expenses.
Inside the Headlines
Net sales for the quarter increased 1.5% year over year to $834.1 million, but missed the Zacks Consensus Estimate of $849 million. Excluding acquisition-related expenses and unfavorable foreign currency translation effect, organic sales rose 2.6% year over year.
Robust sales growth in Snap-on Tools Group supported top-line growth, along with decent performance from the Repair Systems & Information segment. The Commercial & Industrial Group segment sales recovered to some extent, but lacked any meaningful momentum.
Segment-wise, Commercial & Industrial Group sales recovered to some extent, marginally growing year over year (up 0.3%) to $289.3 million. Organic sales were up 1.5%, primarily due to strong performance in the European-based hand tools business. The company’s Asia/Pacific and power tools operations also contributed to the growth, while sales in critical industries were almost flat. Unfavorable foreign currency translation reduced sales by $3.5 million, thereby offsetting the positive organic growth to a large extent.
Snap-on Tools Group revenues continued to show strength and grew 4.4% year over year to $397.2 million. Growth in this segment was driven by solid performance of both the U.S. and international franchise operations. Also, organic sales of the segment were up an impressive 5.6%.
Repair Systems & Information revenues rose 1.1% year over year to $286.1 million. Meanwhile, organic sales of the segment improved 1.7%, driven by higher sales of diagnostics and repair information products. However, sales of OEM dealerships and undercar equipment were almost flat, restricting overall growth of segment revenues. Foreign currency fluctuations reduced revenues by $2.8 million, further limiting sales growth.
On the other hand, Financial Services business reported revenues of $71.6 million, compared with $61.1 million in the year-ago quarter.
Operating earnings before financial services for the quarter came in at $157.6 million, up 9.7% from $143.6 million in the prior-year quarter.
Liquidity
At quarter end, Snap-on’s cash and cash equivalents totaled $117.5 million, compared with $119.2 million at the end of third-quarter 2015. The company’s long-term debt of $713.4 million represented a significant decline from $861.7 million at the end of 2015.
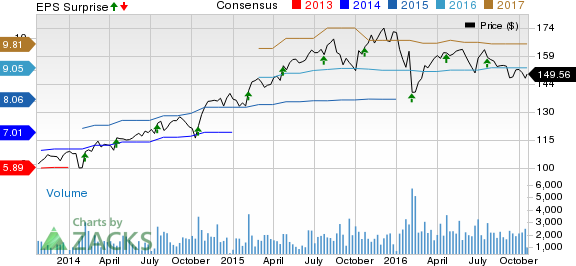
SNAP-ON INC Price, Consensus and EPS Surprise
Going forward
Snap-on’s successful earnings streak for the past several quarters reflects its capabilities to suitably leverage on market opportunities for maximizing growth. The company continues to make significant efforts toward improving its operating efficiency through Snap-on Value Creation Processes, instrumental in improving safety standards, quality and customer connection.
Going forward, Snap-on has devised a comprehensive blueprint for 2016 that involves critical areas like enhancing franchise network, expanding footprint in vehicle repair garage & vital industries, and penetrating emerging markets. For these initiatives, Snap-on expects to incur capital expenditure of $80 million in 2016.
However, currency fluctuations and other macroeconomic issues can continue to be a drag on this Zacks Rank #4 (Sell) company’s financials. Also, the ongoing softness in industrial markets which are affecting client spending may thwart the growth momentum at Snap-on to some extent.
Stocks to Consider
Some better-ranked stocks in the broader sector include Smith & Wesson Holding Corporation (NASDAQ:SWHC) , Callaway Golf Co. (NYSE:ELY) and Electronic Arts Inc. (NASDAQ:EA) , each sporting a Zacks Rank #1 (Strong Buy).You can see the complete list of today’s Zacks #1 Rank stocks here.
Smith & Wesson has an impeccable earnings history over the trailing four quarters, beating estimates all through. It has a striking positive average surprise of 27%.
Callaway Golf has an equally impressive earnings history. It has beaten estimates each time in the trailing four quarters, for a remarkable positive average surprise of 20.3%.
Electronic Arts has achieved a comparable beat streak over the four trailing quarters, having surpassed expectations each time, and registering an average surprise of 32.2%.
Confidential from Zacks
Beyond this Analyst Blog, would you like to see Zacks' best recommendations that are not available to the public? Our Executive VP, Steve Reitmeister, knows when key trades are about to be triggered and which of our experts has the hottest hand. Click to see them now>>
SMITH & WESSON (SWHC): Free Stock Analysis Report
CALLAWAY GOLF (ELY): Free Stock Analysis Report
SNAP-ON INC (SNA): Free Stock Analysis Report
ELECTR ARTS INC (EA): Free Stock Analysis Report
Original post
Zacks Investment Research