Get 40% Off
🚨 Volatile Markets? Find Hidden Gems for Serious OutperformanceFind Stocks Now

Small Caps: This Key Price Level Is Critical

Published 09/21/2015, 11:26 AM
Updated 07/09/2023, 06:31 AM

U.S. Small Caps Since 1980's

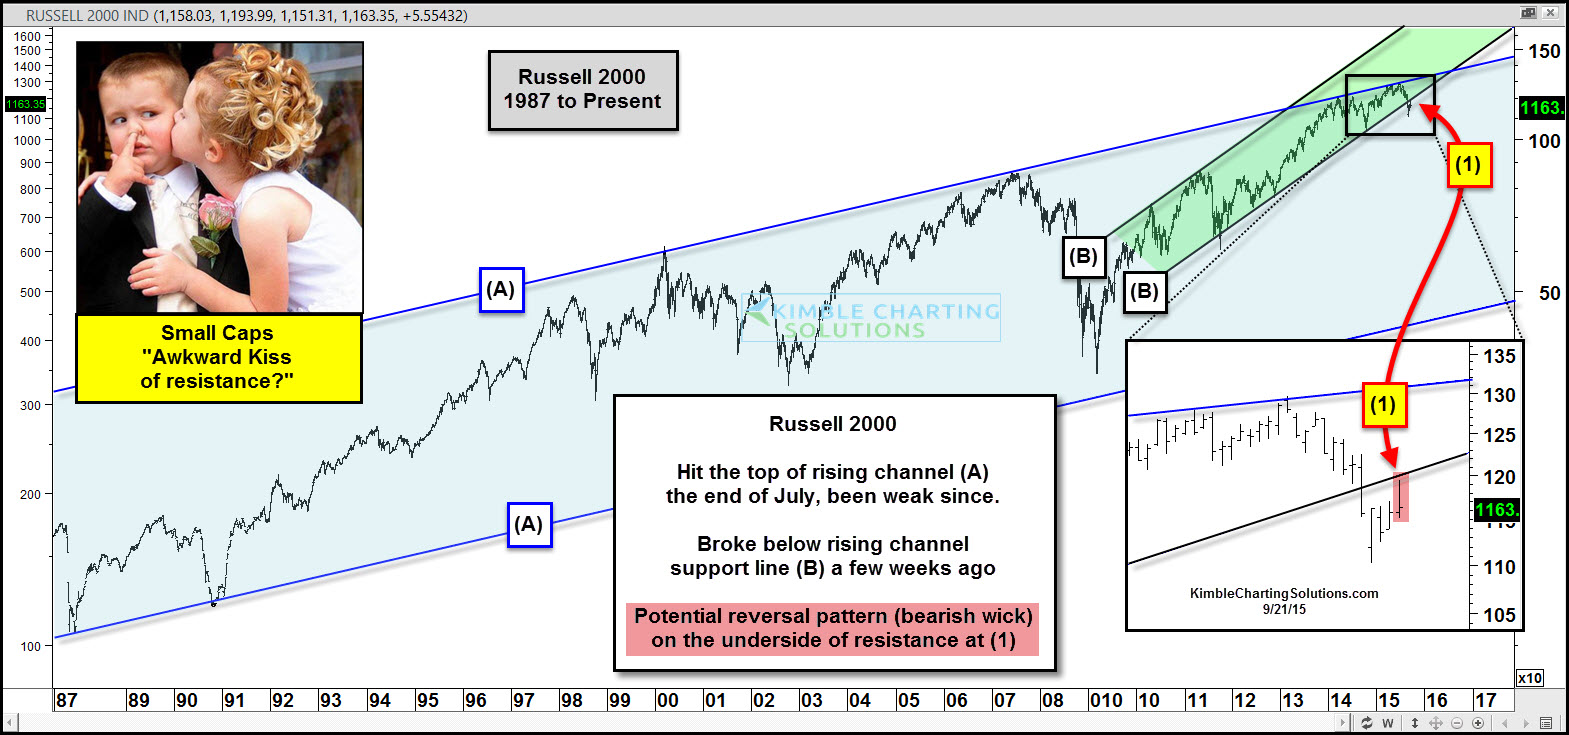
This chart looks at the Russell 2000 (Small Caps) going back the the late 1980’s.

As you can see, the index has stayed within rising channel (A) for the past 25 years. Over the past year, the index has hit the top of channel (A) and made little upward progress after hitting it numerous times over a year's time frame.

Rising channel (B) has been in play over the past 5 years. Last fall, the index at the “Ebola lows” did NOT break support of rising channel (B).

It wasn’t until the past few weeks that support line (B) was broken to the downside.

Last week at (1), the index looks to have made a reversal pattern (bearish wick) at the underside of rising channel (B).

Was this an awkward kiss of resistance at (1), creating a reversal pattern? Sure could be.

For the Russell index to keep pushing higher (continue sending bullish signals), it first needs to climb back inside channel (B).

Small caps would send a negative signal should further weakness take place under the 1,220 level.

Stay tuned friends, price action underneath resistance become pretty important!

Latest comments

Risk Disclosure: Trading in financial instruments and/or cryptocurrencies involves high risks including the risk of losing some, or all, of your investment amount, and may not be suitable for all investors. Prices of cryptocurrencies are extremely volatile and may be affected by external factors such as financial, regulatory or political events. Trading on margin increases the financial risks.
Before deciding to trade in financial instrument or cryptocurrencies you should be fully informed of the risks and costs associated with trading the financial markets, carefully consider your investment objectives, level of experience, and risk appetite, and seek professional advice where needed.
Fusion Media would like to remind you that the data contained in this website is not necessarily real-time nor accurate. The data and prices on the website are not necessarily provided by any market or exchange, but may be provided by market makers, and so prices may not be accurate and may differ from the actual price at any given market, meaning prices are indicative and not appropriate for trading purposes. Fusion Media and any provider of the data contained in this website will not accept liability for any loss or damage as a result of your trading, or your reliance on the information contained within this website.
It is prohibited to use, store, reproduce, display, modify, transmit or distribute the data contained in this website without the explicit prior written permission of Fusion Media and/or the data provider. All intellectual property rights are reserved by the providers and/or the exchange providing the data contained in this website.
Fusion Media may be compensated by the advertisers that appear on the website, based on your interaction with the advertisements or advertisers.
© 2007-2024 - Fusion Media Limited. All Rights Reserved.