Summary: The small cap index is at a new all-time high today, having gained more than 13% in the past 10 days. That type of price behavior has historically been very bullish. Add to that (a) positive seasonality and (b) bearish sentiment just a few weeks ago, and the odds favor further gains into year end. There's just one thing: strong gains like this usually take place during or right after a bear market low. This makes the current rally to new highs an anomaly, having the slight whiff of euphoric capitulation.
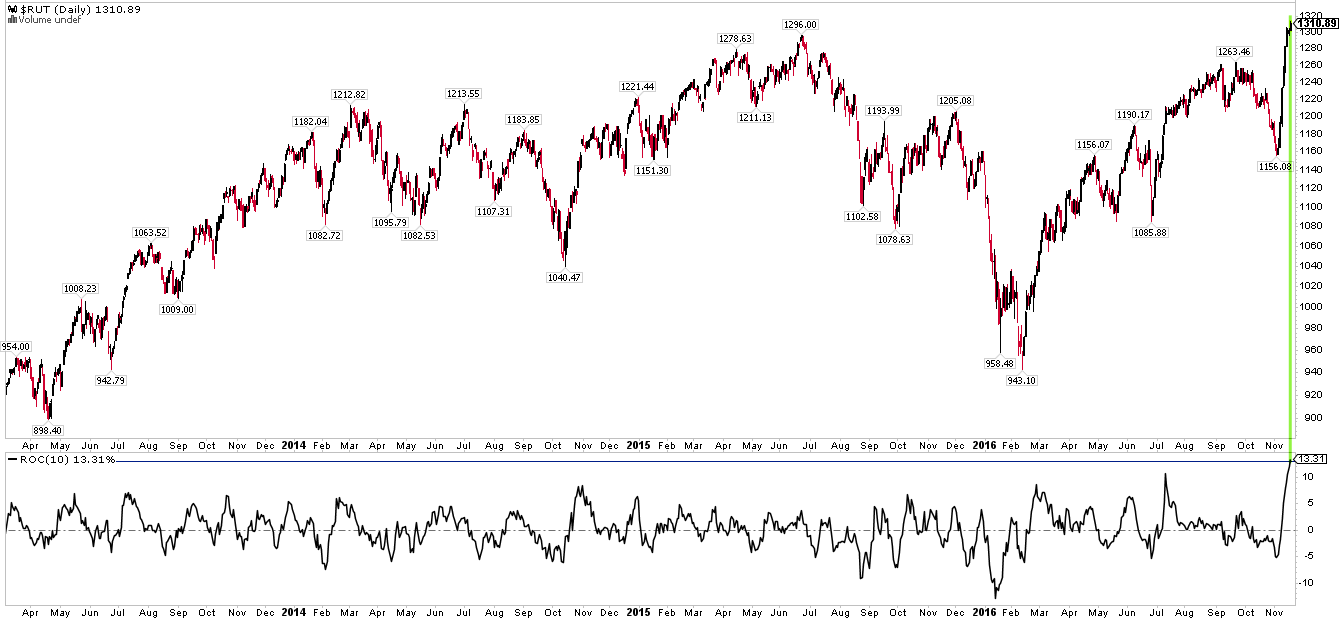
The Russell 2000 index of small-cap stocks is at a new all-time high today. This new high is coming after the index has risen more than 13% over the past 10 days.
We think of strong gains in a short period of time as the initiation of a new uptrend. In other words, stocks fall hard into a capitulatory low and then reverse. The strong "impulse" higher from the low means that investors are switching sides and chasing price higher. That momentum most often continues into the weeks ahead. This is how new uptrends typically begin.
That's not always the case; there are exceptions, but there are exceptions to every pattern in the markets. Still, the odds overwhelming favor further upside: according to Ryan Detrick, RUT has risen more than 13% in a 10-day period 21 times before. In all but one, the index was even higher a month later. Since 1991, the median gain was 3% a month later.
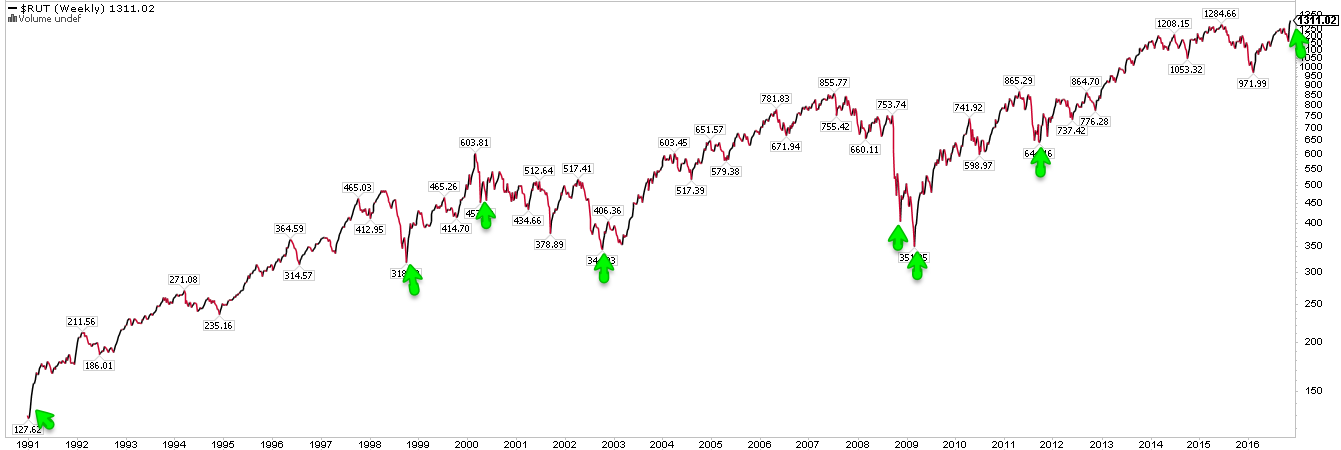
Which makes the current rise over the past 10 days an historical anomaly. The chart below looks at prior gains of 13% over 10 days since 1991. All occurred during or after a bear market. In each case, the gain of 13% either started at a significant low or was within a just few weeks one. Enlarge any image by clicking on it.
In comparison, the current rally started 9 months after RUT made a significant low, in February 2016. The index was more than 20% higher than that when the current gain of 13% started on November 3.
Let's look at the other 9 cases since 1991.
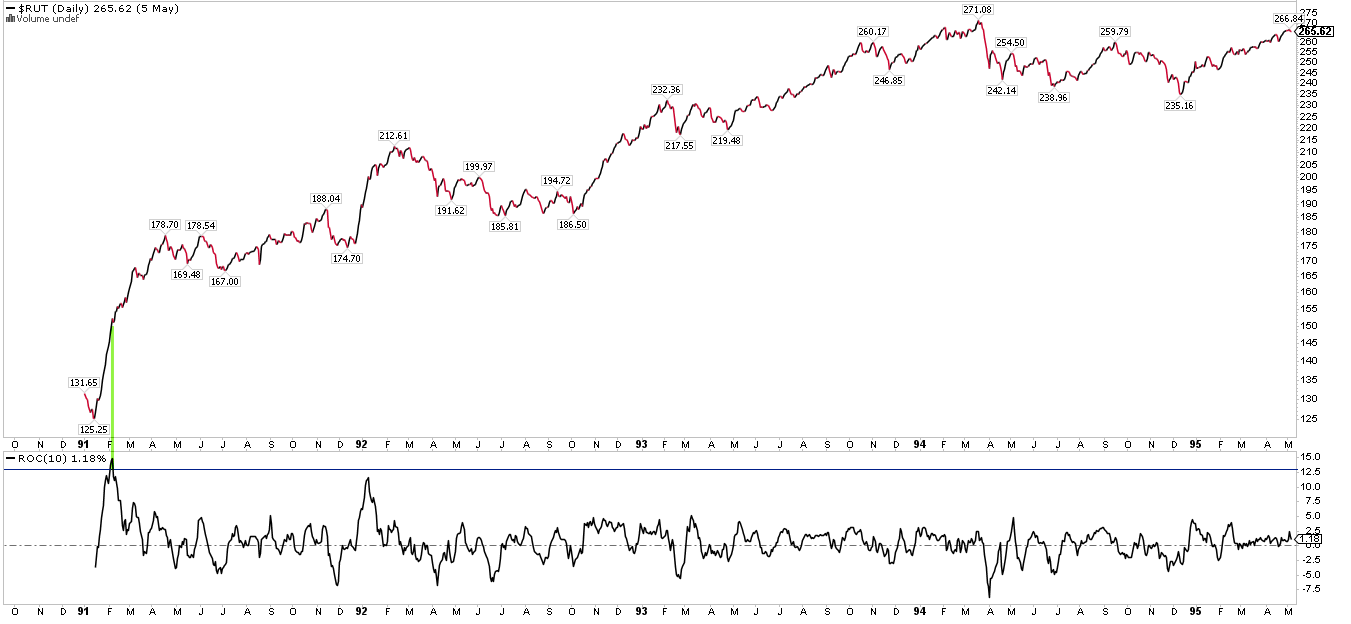
1991 was a bear market low and the strong gains in RUT initiated a fresh bull market during which the index tripled.
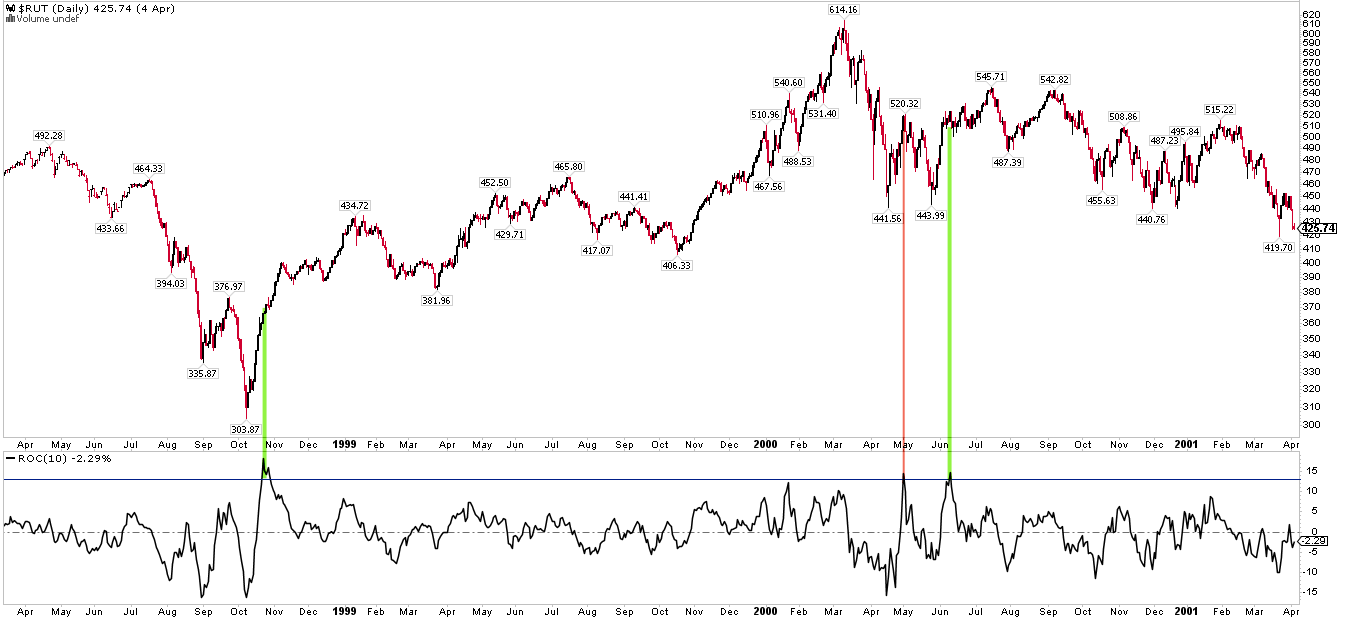
That was also the case in 1998. RUT had fallen 40% in the prior 5 months before doubling in the next 1-1/2 years (first green line in the chart below).
The next bear market started in 2000. After falling 25%, RUT shot up 13% May 2000. That was a false bottom (red line in the chart above). In June, the index shot up again and continued another 6% higher until the events of September 11 sent all the indices lower, with RUT losing more than 30% in the next 2 years (second green line).
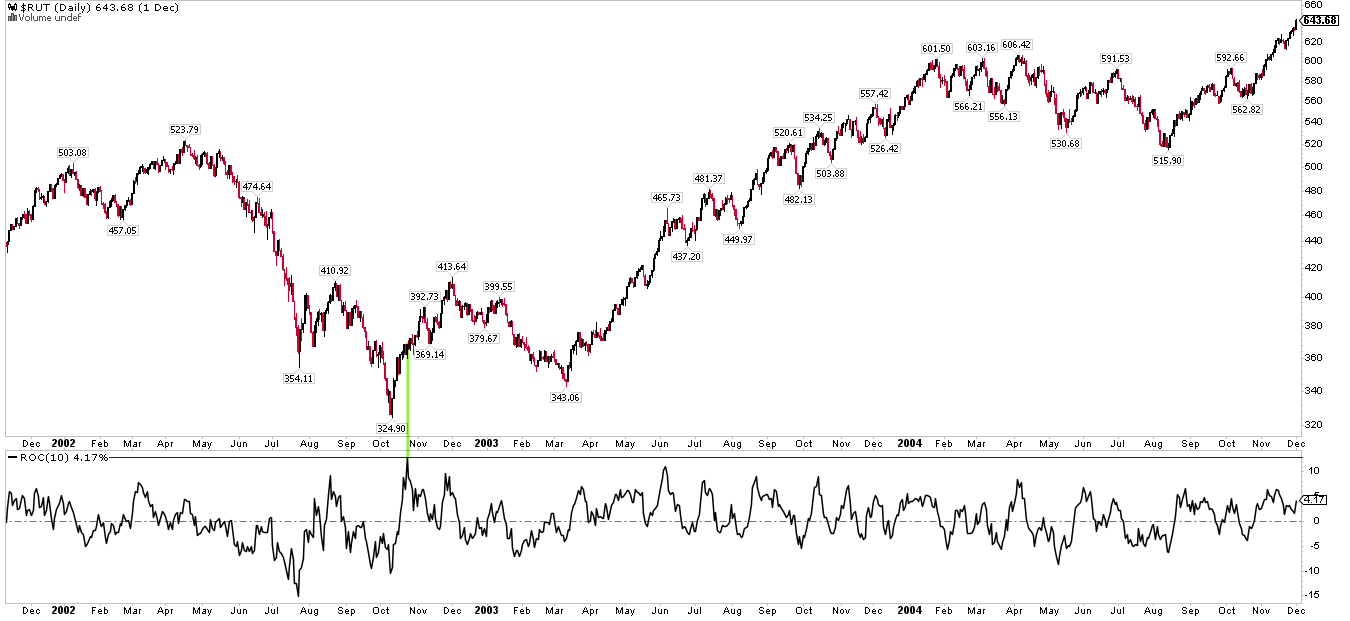
The subsequent bear market low, in October 2002, was also marked by a strong kickoff rally in RUT and the initiation of a new bull market, during which RUT eventually gained 140%.
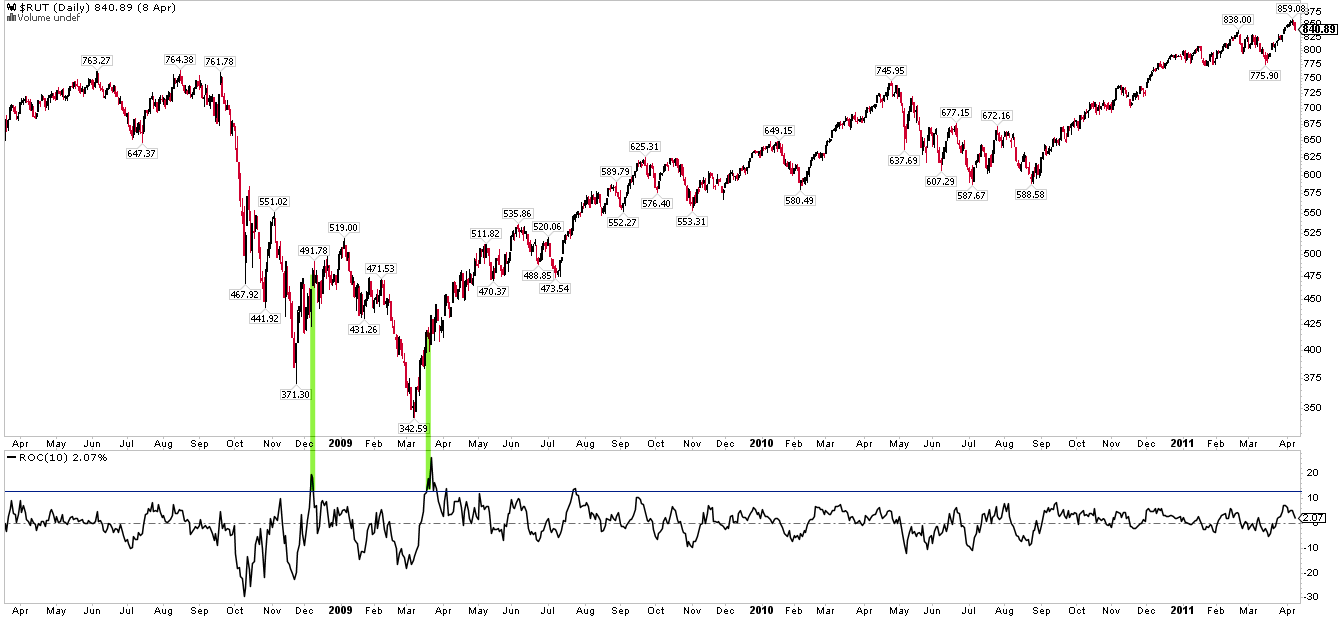
Like the 2000 bear market, the one that ended in 2009 was marked by a false rally before the final low (first green line). Unlike May 2000, RUT continued another 16% higher in December 2008. Of course, March 2009 initiated a new bull market, during RUT doubled in the next 2 years.
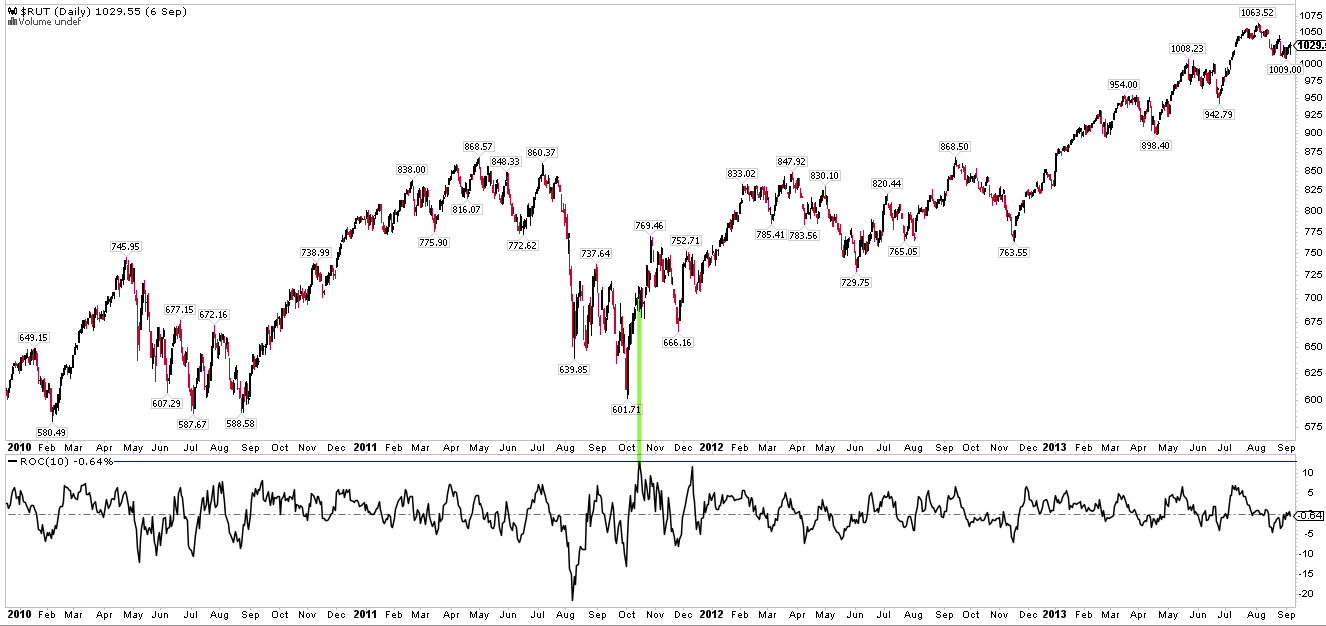
The final example comes from October 2011. Like 1998, RUT had fallen 40% in 4 months before impulsing higher. The index doubled in the next 2 years.
So what does this mean for RUT (and the other indices) now?
Again, in 20 of 21 (95%) prior examples, this "impulse pattern" sent RUT higher a month later, by a median of 3%. Add to that positive end-of-year seasonality and that investor sentiment was very bearish a month ago when the indices were heading into their lows, and the likelihood is that RUT adds to these gains through December (read further here).
It's worth stressing again, however, that the current case is very different from the others. RUT was at a significant low during or after a bear market in each of the others; in comparison, RUT is now already at a new high. On balance, the evidence suggests higher prices are ahead, but a strong gain like this into new highs has the slight whiff of euphoric capitulation.

