
Dividend and dividend growth are great, and for many investors obligatory, but lack of revenue and earnings growth is a problem. A dividend portfolio needs fundamental growth at the top and bottom line. Without that dividends cannot be relied upon for long.
There are slim pickn’s these days, which also lends some weight to those saying the market is more than fully valued, and due for a correction. Only 3/10 of 1% of our stock universe made it through basic filters for historical revenue, earnings and dividend growth, and current yield and forward valuation filters. That doesn’t seem like enough to us for a market that is only “fairly valued”.
Let’s see how filtering can give clues to overall market valuation, and what comes out in a prospect list for detailed consideration.
There are many other factors to consider in stock selection, but a general filter for growth is a good place to start. With that in mind, let’s look at growth sector-by-sector. Even if you do not buy individual stocks and prefer ETFs; and even if you do not seek dividends, comparing growth by sector, may be helpful to you in focusing your attention on particular sectors where growth is more prevalent.
THE RESEARCH UNIVERSE AND DATA SOURCE
Using the database available at Fidelity today, there are 4,558 stocks price of at least $5.00 per share and which are available on the New York Stock Exchange or NASDAQ.
There are only 1,351 companies (29.6%) with at least 3% revenue growth over 5, 3 and 1 years (1,948 with at least 3% growth over 5 and 3 years, but not 1 year; and 2,116 with at least 3% growth over 5 years, but not 3 or 1 years.
Of the 4,558 NYSE/NASDAQ stocks trading at $5.00 or more, 778 (17.1%) had EPS growth of 3% or more over 5, 3 and 1 years (1,368 with at least 3% growth over 5 and 3 years, but not 1 year; and 1,909 with at least 3% earnings growth over 5 years, but not 3 or 1 years).
[Note: as we go through the stats that the totals vary slightly, because the database we used is constantly being updated during the day – as a result the number of stocks passing filters vary somewhat between screens during a review session.]
Let’s look at growth by sector – first examining revenue, then earnings.
BY REVENUE
Sector-by-sector, the percentage and number of companies with at least 3% revenue growth rate over 5, 3 and 1 years are:
- (48.5%) information technology 300 of 619
- (44.7%) healthcare 182 of 407
- (43.4%) consumer staples 69 of 159
- (39.3%) energy 123 of 313
- (37.4%) consumer discretionary 198 of 529
- (33.4%) industrials 161 of 482
- (29.4%) telecommunications 20 of 68
- (24.1%) financials 225 of 937
- (23.7%) materials 49 of 207
- (18.1%) utilities 20 of 111
BY EARNINGS PER SHARE
Sector-by-sectors for EPS growth, the percentage and number of companies with at least 3% EPS growth over 5, 3 and 1 years are:
- (29.6%) consumer staples 47 of 159
- (29.1%) consumer discretionary 154 of 529
- (24.3%) utilities 27 of 111
- (21.8% information technology 135 of 619
- (21.8%) industrials 105 of 482
- (18.4%) healthcare 75 of 407
- (17.0%) financials 159 of 937
- (15.5%) materials 32 of 207
- (11.5%) energy 36 of 313
- (10.3%) telecommunications 7 of 68
BY REVENUE AND EARNINGS TOGETHER
Ideally, one would look for companies with both revenue and earnings growth meeting minimums. With both the revenue and earnings minimums combined, the population of companies for more individual review reduces to only 436 in total or 7.8% of the universe of 4,558:
- (22.0%) consumer staples 35 of 159
- (17.2%) consumer discretionary 91 of 529
- (13.5%) healthcare 55 of 407
- (13.2%) information technology 82 of 619
- (13.1%) industrials 63 of 482
- ( 8.3%) energy 26 of 313
- ( 8.2%) materials 17 of 207
- ( 6.3%) utilities 7 of 111
- ( 6.2%) financials 58 of 937
- ( 2.9%) telecommunications 2 of 68
ADD YIELD AND DIVIDEND GROWTH FACTOR
Of course, as conservative investors overseeing accounts in or near the retirement withdrawal stage, we would prefer some yield, to divide our total return opportunity and risk between cash in hand and capital appreciation.
By requiring our selections to have a yield of at least 2% (a tad more than the S&P 500), that population of 436 companies that had both revenue and earnings growth of at least 3% for 5, 3 and 1 year reduces to 71 companies (1.6% of the universe).
By also wanting our dividend stocks to have some payment history and some growth in dividends as well as growth in revenue and earnings, we added a 3% five-year dividend growth requirement. That reduced the population to 41 stocks (0.9% of the universe).
Not wanting to invest in any stocks that recently cut its dividend, we also required that the current year-over-year dividend payment show no decrease. That did not eliminate any stocks.
ADD PEG RATIO FACTOR
Lastly, we think that general growth at a reasonable price argument makes good sense, so we add a PEG element to the screen limiting the PEG range 0x to 2x (where the zero eliminates negative forward looking earnings estimates). That reduced the list to 13 stocks (0.3% of the universe).
- (GPC) Genuine Parts
- (TUP) Tuperware
- (LO) Lorillard
- (ARLP) Alliance Resource Partners
- (MMP) Magellan Midstream Partners
- (BLK) Blackrock
- (CPSI) Computer Programs and Systems
- (CHRW) C.H. Robinson Worldwide
- (CPA) Copa Holdings
- (DE) Deere
- (HCSG) Healthcare Services Group
- (TAL) Tal International
- (MSFT) Microsoft
The sector representation is:
- (1.04%) industrials 5 of 482
- (0.64%) energy 2 of 313
- (0.63%) consumer staples 1 of 159
- (0.38%) consumer discretionary 2 of 529
- (0.25%) healthcare 1 of 407
- (0.16%) information technology 1 of 619
- (0.11%) financials 1 of 937
- (0.00%) materials 0 of 207
- (0.00%) utilities 0 of 111
- (0.00%) telecommunications 0 of 68
These low percentages add weight to the argument that the market is more than fully valued. It would seem that a higher percentage of stocks in each sector should be available with revenue, earnings and dividend growth at least a market level of yield, and a PEG ratio of 2 or less – but that is not the case today. This along with other work we do in our monthly newsletter Rational Risk Equity Income Investor, suggests slim pickin’s these days, and that is a gray cloud over the market in our view.
FILTER DATA FOR THE 13 SURVIVORS
With that lucky “13” number (3/10 of 1% of the 4,558 stock universe), we’ll leave the rest to you to see if any other of the filter survivors are attractive and suitable for you due to these and other factors. 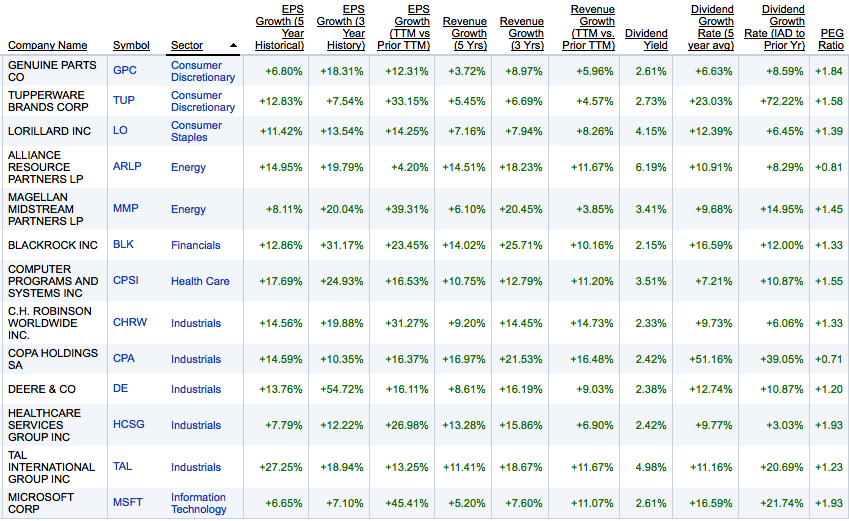
BETA FOR THE SURVIVORS
For those in the withdrawal stage of their financial lives who are also selling shares in addition to collecting dividends (or for those who may be on margin and need more stable prices on those shares on which the margin is based), and perhaps for those fearing a correction in stock prices; paying attention to Beta makes sense.
Beta the reactivity of the stock to price changes in the S&P 500 — a value above 1.00 shows that historically when the S&P 500 moved X%, the stock moved more; and a value below 1.00 means it moved less.
SOME INDEPENDENT ANALYST VIEWS
There are many factors not considered in this article that you should evaluate, from this reduced research list.
To the extent that you are interested in the view of independent analyst firms, we point out that neither S&P Capital IQ nor Value Line had any below neutral opinions as to year ahead performance for any of the 13 stocks; and the aggregate opinions of two Thompson Reuters services “StarMine” and “I/B/E/S” also have no below neutral ratings for any of those stocks.
On Fair Value, S&P Capital IQ rated DE, ARLP, MSFT and CHRW as undervalued; and CPSI, HCSG, GPC and MMP as overvalued.
Value Line rated DE, MSFT and LO as 1 or 2 (favorably) for Timeliness, and ARLP, MMP and GPC as 4 or 5 (unfavorably) for Technical Condition.
SOME TABULAR TECHNICAL CONDITION DATA
This tabular data based on Thompson Reuters data manipulated with in-house formulas via the Metastock tool shows some important technical condition aspects of the 13 stocks.
Description of Column Headings: The first column to the right of the company name is the ratio of the market price to the 200-day moving average (greater than 1.00 is preferred). The next column is the ratio of the 200-day average divided by the average 10 days ago (to give a view of the direction of the “leading tip” of the average — greater than 1.00 means “up”). The next column indicates whether the slope of the 252-day linear regression trend line is up or down (1 = up and 0 = down). The next column is the ratio of the 50-day average to the 200-day average (greater than 1.00 is preferred).
The next column is the Relative Strength Index (more than 70 is overbought, and under 30 is oversold). The next column titled “Z-score 200″ is the number of standard deviations the price is from the 200-day average (0.00 means the price is at the 200-day average — the larger the absolute value of the Z-score, the higher the probability the price will move back toward the moving average). The last column, labeled “Price Channel Position 63″ shows where the price is located in the 63-day price range from its high to its low (because the range is defined on the prior day, it is possible for the current price to be above 100 or below 0 — a larger number is closer to the high and a lower number is closer to the low).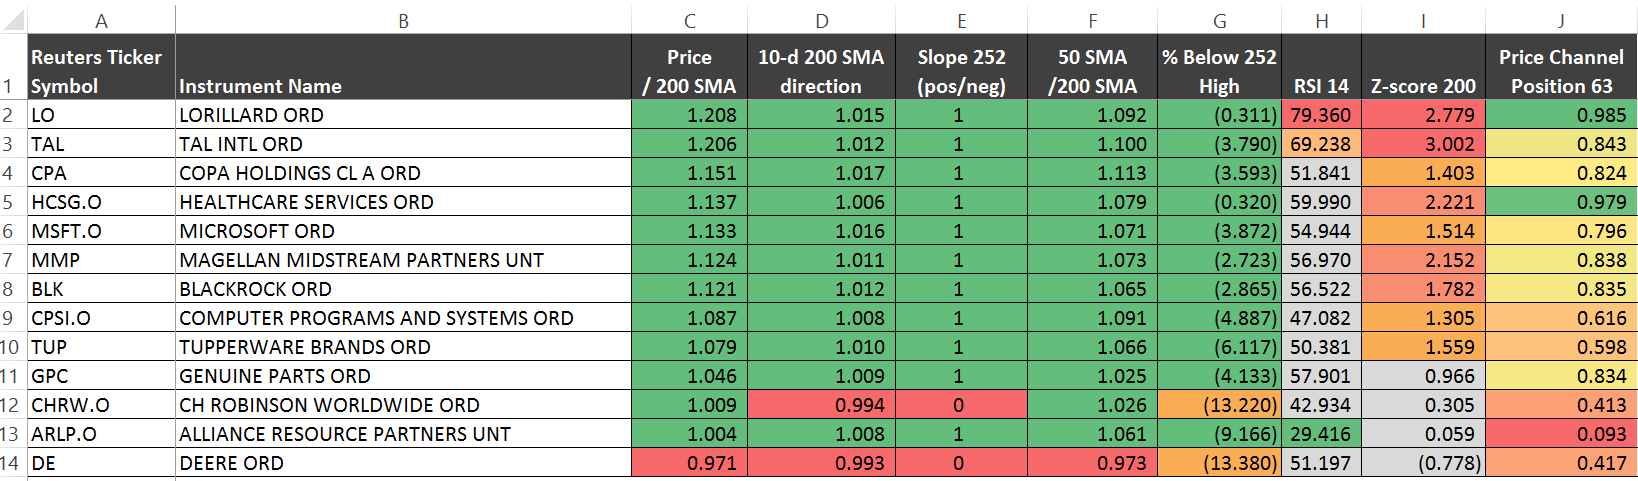
PRICE RATE OF CHANGE DATA
This table shows the price rate of change (not total return – just price) over several time periods (5, 21, 63 and 252 days, which is 1 week, 1 month, 1 quarter and 1 year).
POSITION DISCLOSURE:
We own BLK, TUP, GPC as of this writing.