Get 40% Off
🚨 Volatile Markets? Find Hidden Gems for Serious OutperformanceFind Stocks Now

Stock SLCA: Possible Short Term Reversal

Published 01/20/2015, 12:30 AM
Updated 07/09/2023, 06:31 AM

Following two rounds of heavy selling from an all-time high US Silica Holdings, (NYSE:SLCA) has been trying to find at least an interim bottom over the last month.
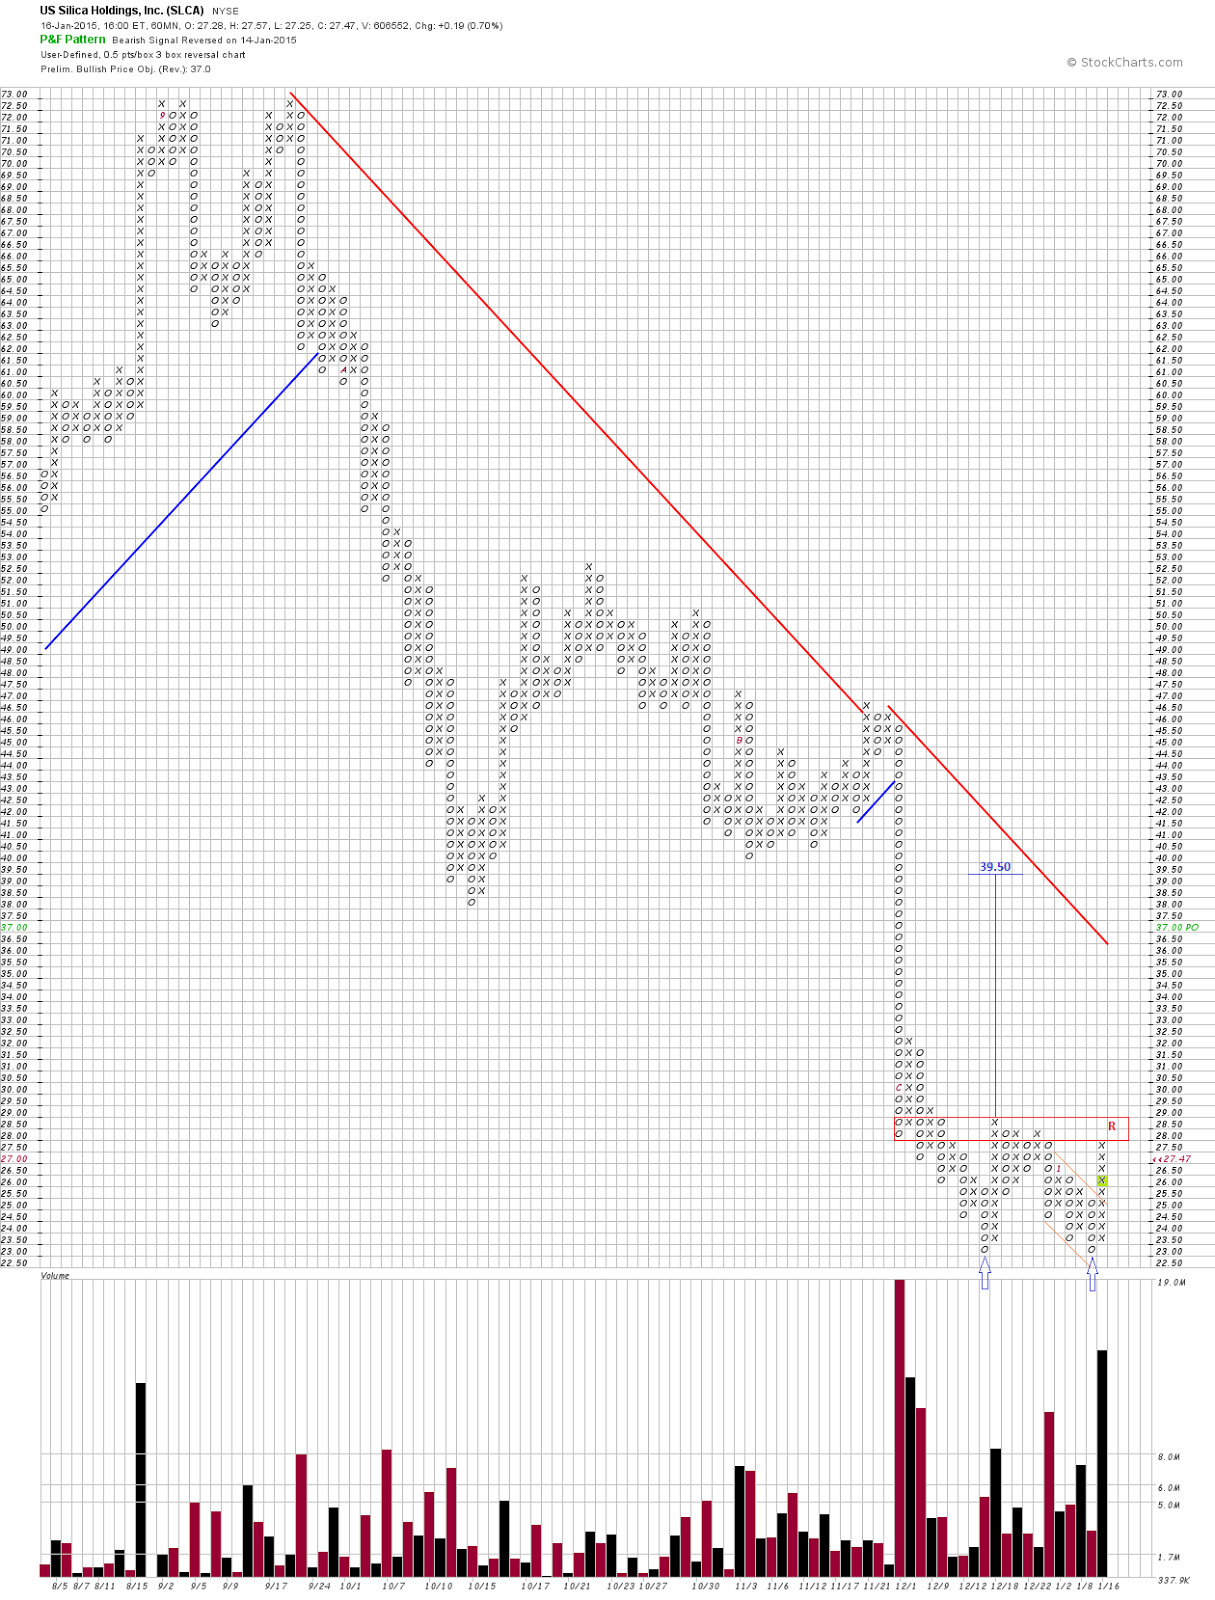
SLCA: P&F Chart

On the intermediate-time horizon P&F chart SLCA has formed a double bottom (blue arrows) combined with a reversal pattern – a bearish pattern reversed (orange lines). An upward breakout from this pattern triggered a buy signal (lime box). Should SLCA manage to clear the overhead resistance (red rectangle) and rise to 29 and higher, a fulcrum bottom would be formed and a vertical count with the potential upside target of 39.5 would be activated. Weakening down volume and rising up volume favor this possibility. The recent insider buying in the range of 24-27 is also an encouraging sign.
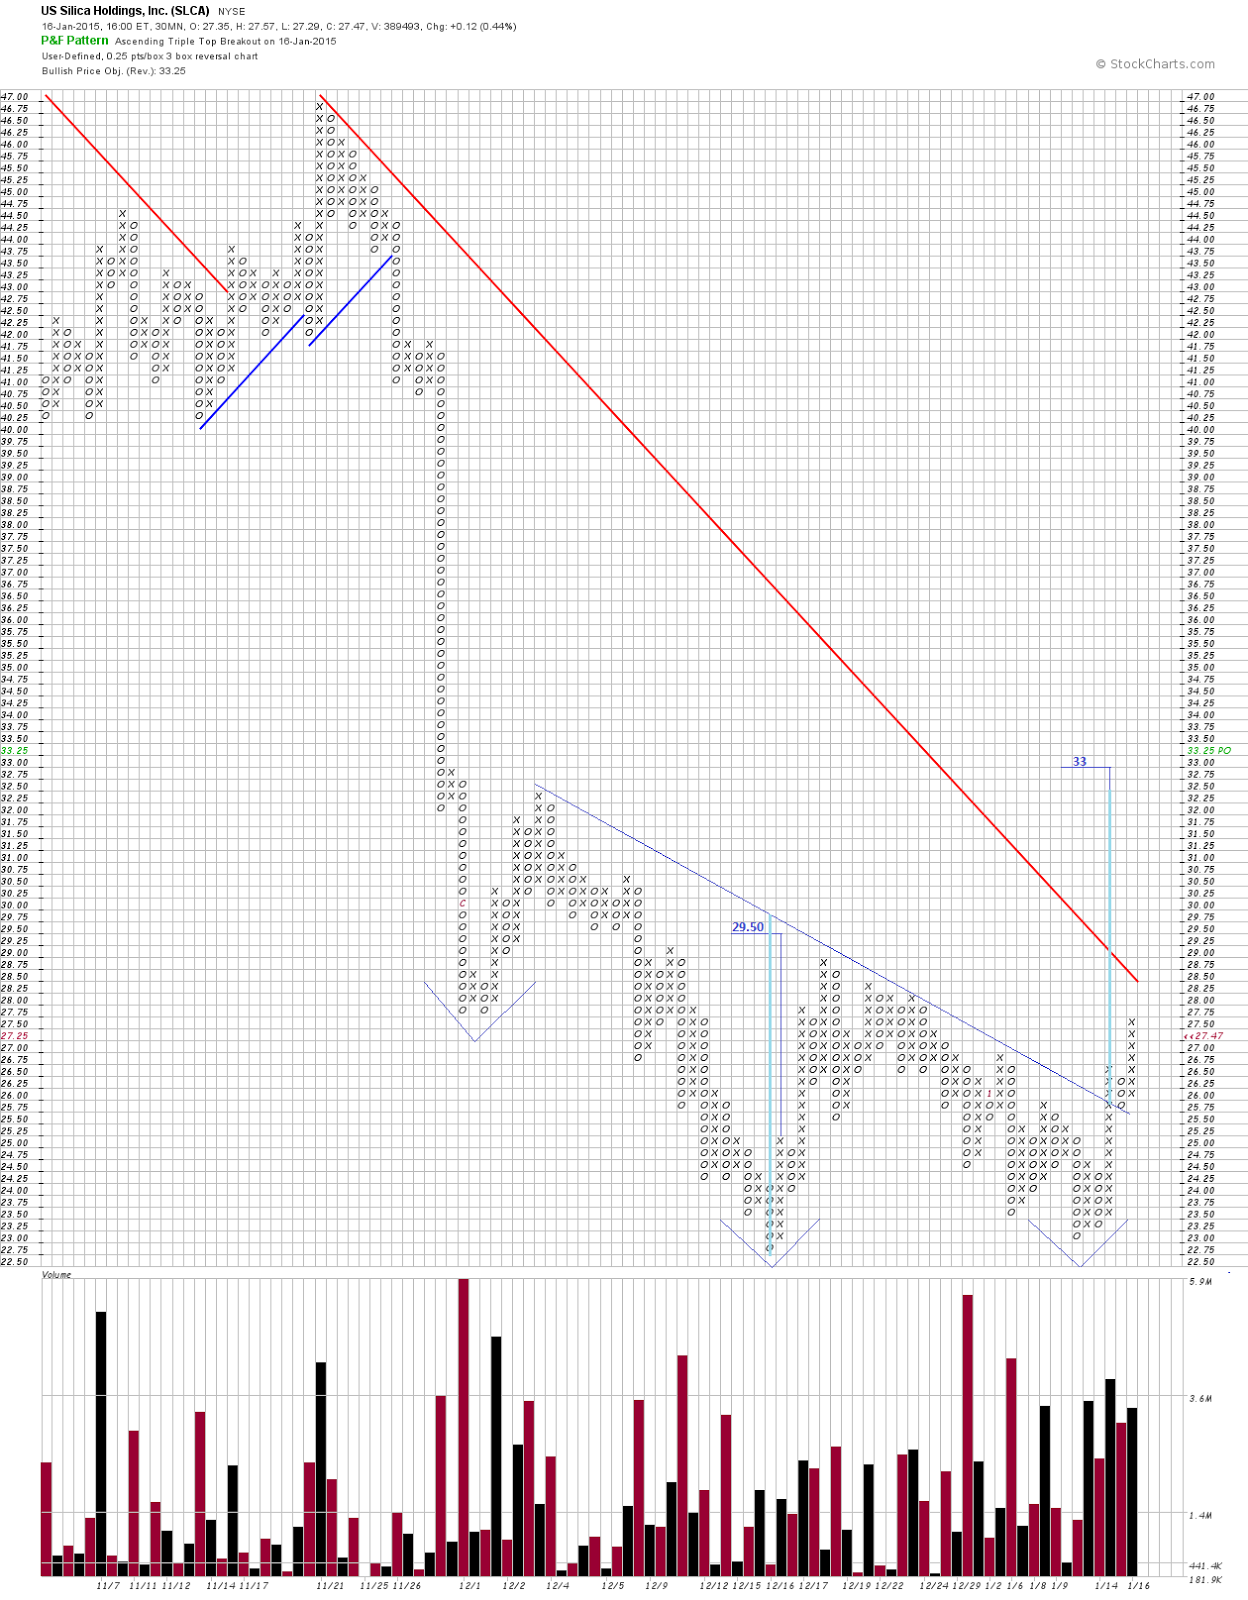
SLCA: Short horizon P&F Chart

Let’s zoom in to the short-time horizon chart. Followers of the classical technical analysis can recognize a skewed inverse head and shoulders pattern. Though it may be just random price fluctuations, a breakout on high volume above the falling trendline increases chances of the short-term reversal. Two vertical counts point to potential upside targets of 29.50 and 33. A measured move from the inverse head and shoulders pattern (light blue) projects the target at 32.50.

Since SLCA is still in a downtrend, long positions are at greater risk. If prices fall to 25 and lower, the short-term reversal scenario should be reconsidered.

Disclaimer: Long March 24 Calls. I express only my personal opinion on the market and do not provide any trading or financial advice (see Disclaimer on my site).

3rd party Ad. Not an offer or recommendation by Investing.com. See disclosure here or remove ads .

Latest comments

Risk Disclosure: Trading in financial instruments and/or cryptocurrencies involves high risks including the risk of losing some, or all, of your investment amount, and may not be suitable for all investors. Prices of cryptocurrencies are extremely volatile and may be affected by external factors such as financial, regulatory or political events. Trading on margin increases the financial risks.
Before deciding to trade in financial instrument or cryptocurrencies you should be fully informed of the risks and costs associated with trading the financial markets, carefully consider your investment objectives, level of experience, and risk appetite, and seek professional advice where needed.
Fusion Media would like to remind you that the data contained in this website is not necessarily real-time nor accurate. The data and prices on the website are not necessarily provided by any market or exchange, but may be provided by market makers, and so prices may not be accurate and may differ from the actual price at any given market, meaning prices are indicative and not appropriate for trading purposes. Fusion Media and any provider of the data contained in this website will not accept liability for any loss or damage as a result of your trading, or your reliance on the information contained within this website.
It is prohibited to use, store, reproduce, display, modify, transmit or distribute the data contained in this website without the explicit prior written permission of Fusion Media and/or the data provider. All intellectual property rights are reserved by the providers and/or the exchange providing the data contained in this website.
Fusion Media may be compensated by the advertisers that appear on the website, based on your interaction with the advertisements or advertisers.
© 2007-2024 - Fusion Media Limited. All Rights Reserved.