How much influence do investors have over their portfolios? Perhaps it’s less than commonly assumed. The notion that randomness plays a role in money management has been widely studied in finance–Nassim Taleb’s popular treatment in Fooled by Randomness: The Hidden Role of Chance in Life and in the Markets is one example. The concept is a staple in the money game, although it’s easily overlooked, even ignored in some cases. Consider a simple rebalancing strategy. Does it matter which dates you choose to return a portfolio mix back to the target weights? Maybe, but the details matter quite a lot in terms of the answer. For instance, crunching the numbers on an 11-fund portfolio with a Dec. 31, 2003 start date shows that randomly choosing rebalancing dates tends to perform as well if not better than a consistent year-end remix and a buy-and-hold strategy.
This is far from the final word on the subject, but the results from the test below show that for the years 2004-2015 (through Sep. 4) a random choice of 11 rebalancing dates (to match the number of year-end events for that period) delivered a surprisingly competitive/superior range of results for 1,000 portfolios. Surprising because quite a lot of attention and research has been directed over the years in looking for optimal rebalancing dates. But as we’ll see, it’s not clear that spending a lot of time searching for the best dates is a productive use of time and resources if your rebalancing system is a plain-vanilla design.
That doesn’t mean you shouldn’t rebalance. Rather, the analysis below suggests that moving heaven and earth in search of optimal rebalancing dates may be a waste of time for a basic portfolio set-up. The results also imply that in order to add value over a random choice of rebal dates, you’ll probably have to use a relatively sophisticated set of rules for asset allocation design and management.
Otherwise, let’s say that you’re planning on ten rebalancing events over the next decade as a risk-management system. It appears that randomly choosing ten dates over the coming decade is expected to do about as well, perhaps better, than a carefully designed system that’s focused on choosing the ten best dates in real time.
Is that a reason to embrace a tactical asset allocation design? In a future post I’ll look at how random rebalancing rules interact with a dynamic asset allocation system. Meantime, let’s review how random rebalancing dates compare with a buy-and-hold strategy and a year-end rebalancing system that returns the mix to preset target weights.
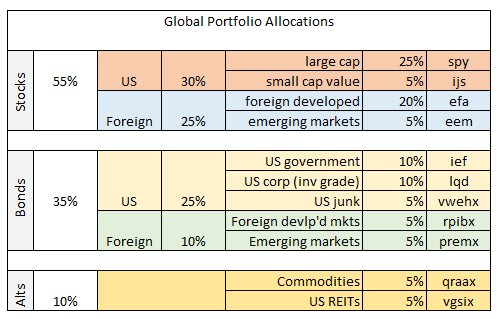
First, let’s define the test portfolio. The following is a twist on the 60/40 stock/bond mix. We’ll take five percentage points from each asset and reallocate to so-called alternatives: a broad-basket definition of commodities and real estate (US real estate investment trusts). For the remaining stocks and bonds, we’ll divide allocations into a more granular set of US and foreign allocations:
Note the mix of mutual funds and ETFs, which is necessary for a Dec. 31, 2003 start date–ETFs have a relatively limited history for such a broad mix. The limitation requires looking for alternative open-end products in search of a sufficiently long track records for a backtest. In some cases there are superior funds available for building a portfolio today. But I’ve made some compromises in the interest of crunching the numbers with a single, continuous set of real-world performance histories for the sample period. Meanwhile, here’s the R code I wrote to analyze the data.
The backtest is simply choosing 1,000 random sets of 11 rebalancing dates that fall between Jan. 1, 2004 and Sep. 3, 2015. Why 11 dates? Because that matches the 11 year-end rebalancing events for the benchmark portfolio. For additional perspective, I’ve included a buy-and-hold portfolio that allows the market’s ebb and flow to manage the asset allocation.
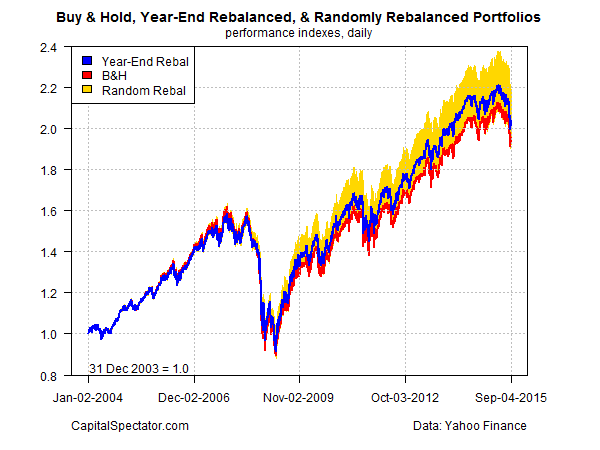
The results tell us that a year-end rebalancing regimen (blue line in chart below) delivered a moderately higher return over the sample period vs. a buy-and-hold strategy (red line). A $1 investment in a portfolio that reset the asset mix to the weights noted above at the end of each year grew to roughly $2.01 by last Friday (Sep. 4, 2015). By comparison, the buy-and-hold results were moderately lower, rising to around $1.93. Note too that the year-end rebalanced portfolio’s volatility (standard deviation of daily returns) was 6% lower relative to the buy-and-hold portfolio.
As for the 1,000 randomly rebalanced portfolios (shown by the gold performance band in the chart), the results were quite good. The worst performance more or less tracked the buy-and-hold strategy; the best performer raised an initial $1 investment to $2.16 by the end of the sample period. Notably, most of the random returns exceeded the year-end strategy’s results.
The basic message: rebalancing is a valuable tool for generating superior risk-adjusted performance. But it seems that tapping into this value-added service doesn’t require a lot of intellectual firepower for a standard asset allocation strategy. Letting a monkey choose the rebalancing dates over a period of years works as well if not better than automatically rebalancing at the end of each year.
To be fair, it’s possible that a more sophisticated system for choosing rebalancing dates could do better–adding a momentum filtering system, for instance. It’s also possible that applying this test to a different period of time—and/or a different set of funds–would produce different results. In future posts, I’ll explore how variations on the theme tested above compares.
Meanwhile, the results above suggest that many (most?) of the impressive performance records for multi-asset class portfolios over the past decade or so may be due to dumb luck.


