There are a lot of fine words being written about how attractive silver is at current prices and how it is about to enter a new bullmarket etc, but the plain truth is that it remains in a major downtrend and is a bearmarket until it breaks out of it.
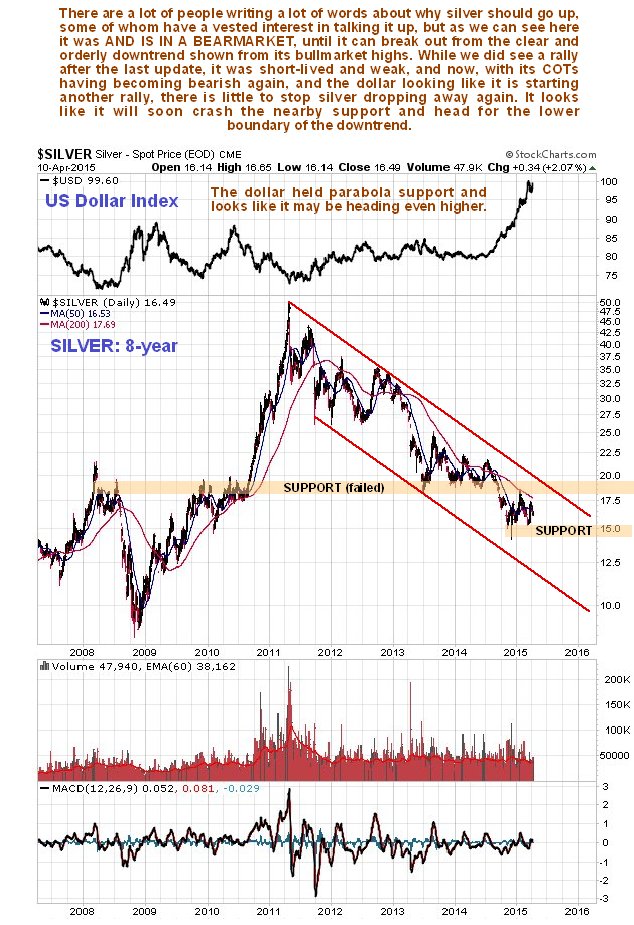
We can see the long persistent downtrend in silver on the 8-year chart below, and how, as yet, there is no sign of an end to it. If the dollar broke down from its parabolic uptrend, shown on a chart in the parallel Gold Market update, that might change things of course, but last week the dollar looked to be getting ready for a breakout to new highs, so that appears to be off the table for now. Instead, the danger is that silver is moving sideways in a bear consolidation prior to breaking down to new lows. If it breaks down beneath the nearby support shown on the chart soon, it can be expected to drop to the lower boundary of the big downtrend channel, which means it would drop to the $11 - $12 area.
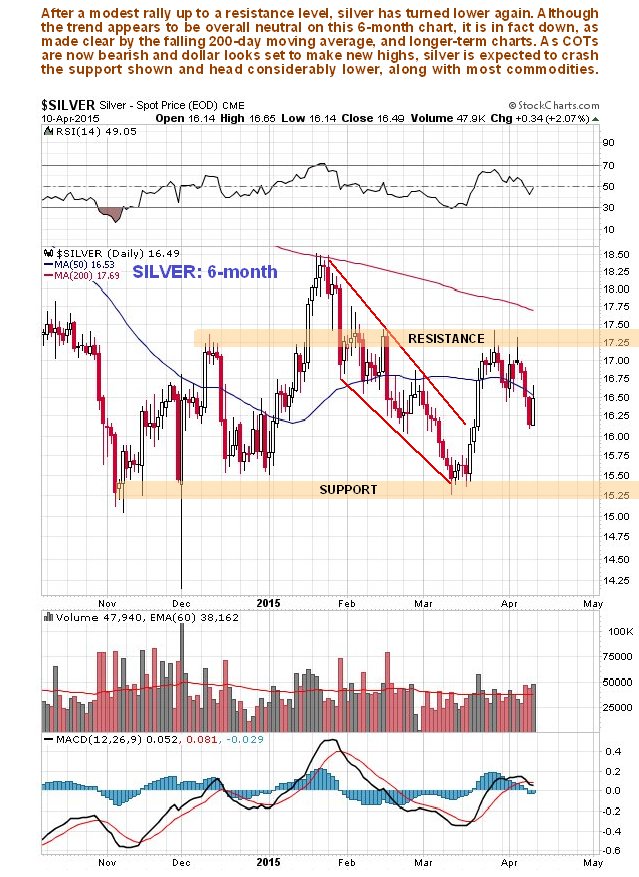
On its 6-month chart we can see that after a short-lived and feeble rally, silver got turned back by a resistance level and is in retreat again from a minor top. Moving averages are in bearish alignment. With its COT having turned negative again, and the dollar looking like it is starting another upleg, silver looks set to drop back initially to the support in the $15.20 - $15.40 area, before breaking below this to head down towards the lower boundary of the channel shown on the 8-year chart.
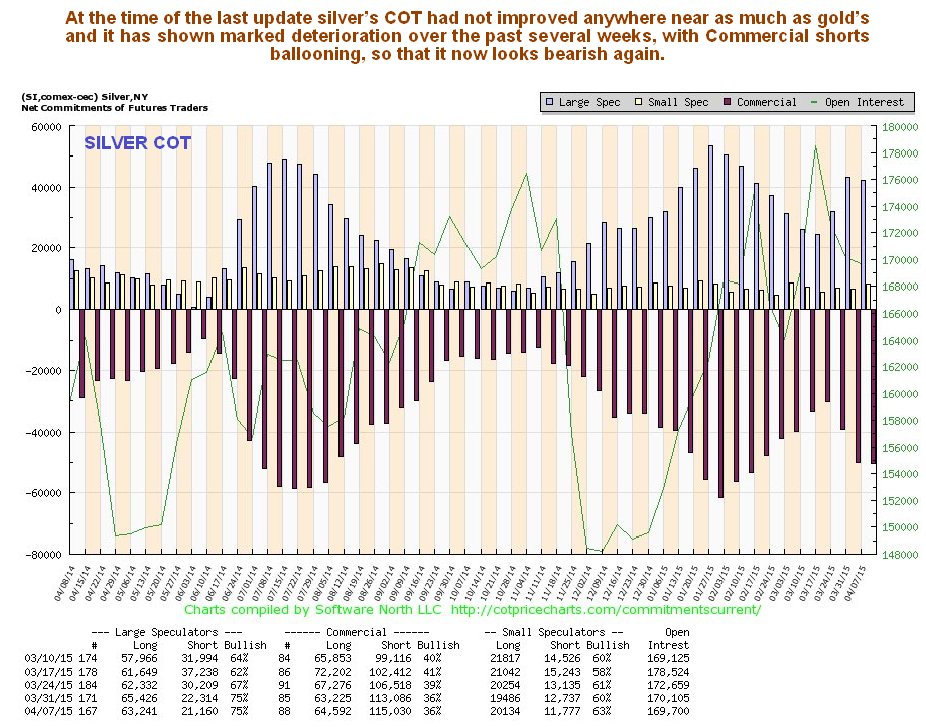
On the latest COT chart we can see how Commercial short positions have ballooned rapidly over the past several weeks to reach levels that are definitely bearish – silver now looks set to take a serious hit.
Click on chart to popup a larger clearer version.
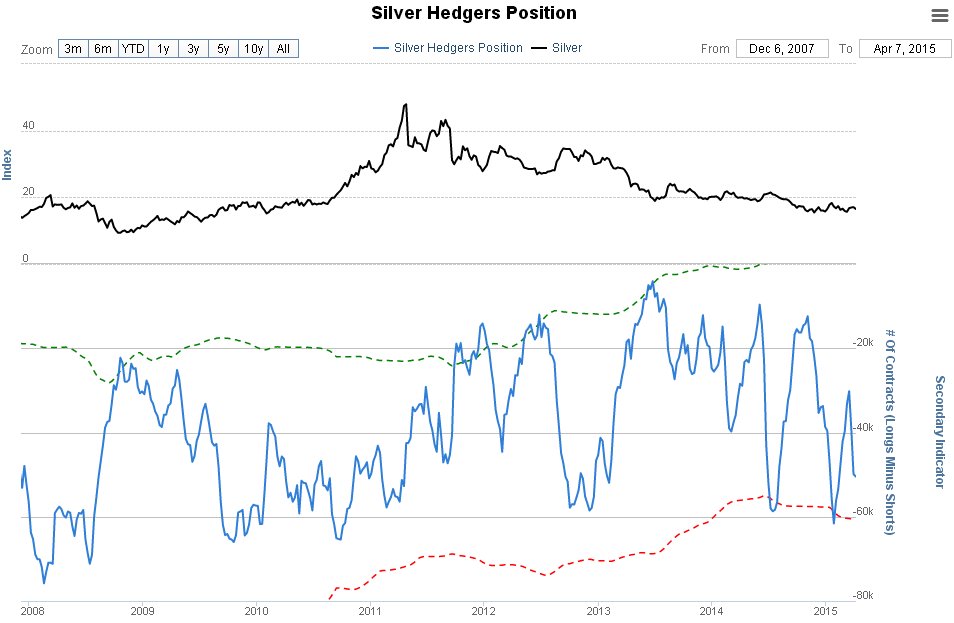
The latest silver Hedgers chart is already quite bearish and allows for a significant drop to occur…
Click on chart to popup a larger clearer version.
Chart courtesy of www.sentimentrader.com
The latest silver Optix, or optimism chart, shows that bullishness on silver perked up substantially on the latest feeble rally, so that readings on this chart are now in middling ground, and provide little guidance one way or the other regarding silver’s next move (unlike some of the other indicators mentioned).
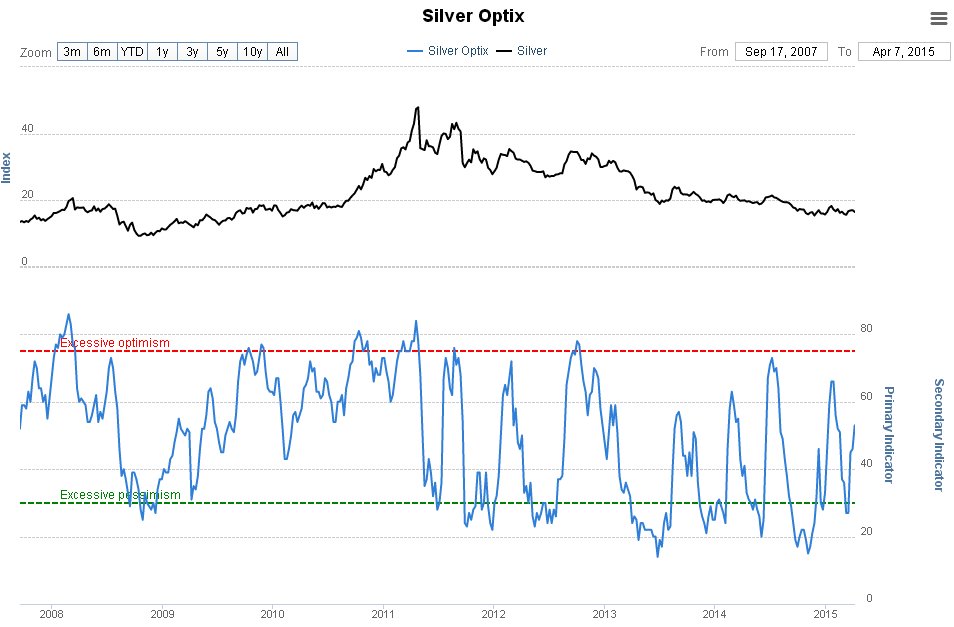
Click on chart to popup a larger clearer version.
Chart courtesy of www.sentimentrader.com
Conclusion: with COTs now quite strongly bearish again and the dollar looking like it is starting another upleg, silver is set up to get whacked again. What would it take to abort this scenario? – simple, a dollar breakdown from its parabolic uptrend, but that doesn’t look likely after last week’s action.
