Currently skepticism toward the ongoing rally in the precious metals sector is rampant. A lot of it based on shamelessly presented analysis of the COT data. But the COT data analysts have been wrong since March on their doom and gloom outlook based on the attributes of the long/short data in the weekly COT report.
Let me preface this with the proviso that the veracity of the COT data is predicated on the reliability of reports generated by the likes of JP Morgan, HSBC and Scotia. If these banks are providing bona fide, non-fraudulent Comex data reports, it would be the only area of their entire business for which they are not publishing corrupted financial information.
The narrative promoted by the various false prophets of the precious metals market will have you believe that the net short position of the Comex bullion banks and the net long position of the hedge funds is at a record high and thus we can expect a massive price decline because of this. But the presentation format is highly misleading.
My fund partner compiles the weekly COT data back to April 2005. Too be sure, the open interest in silver futures is at an all-time high right now. But the “net” short / “net” long is quite different than might be construed from the piggishly superficial drivel that has been published.
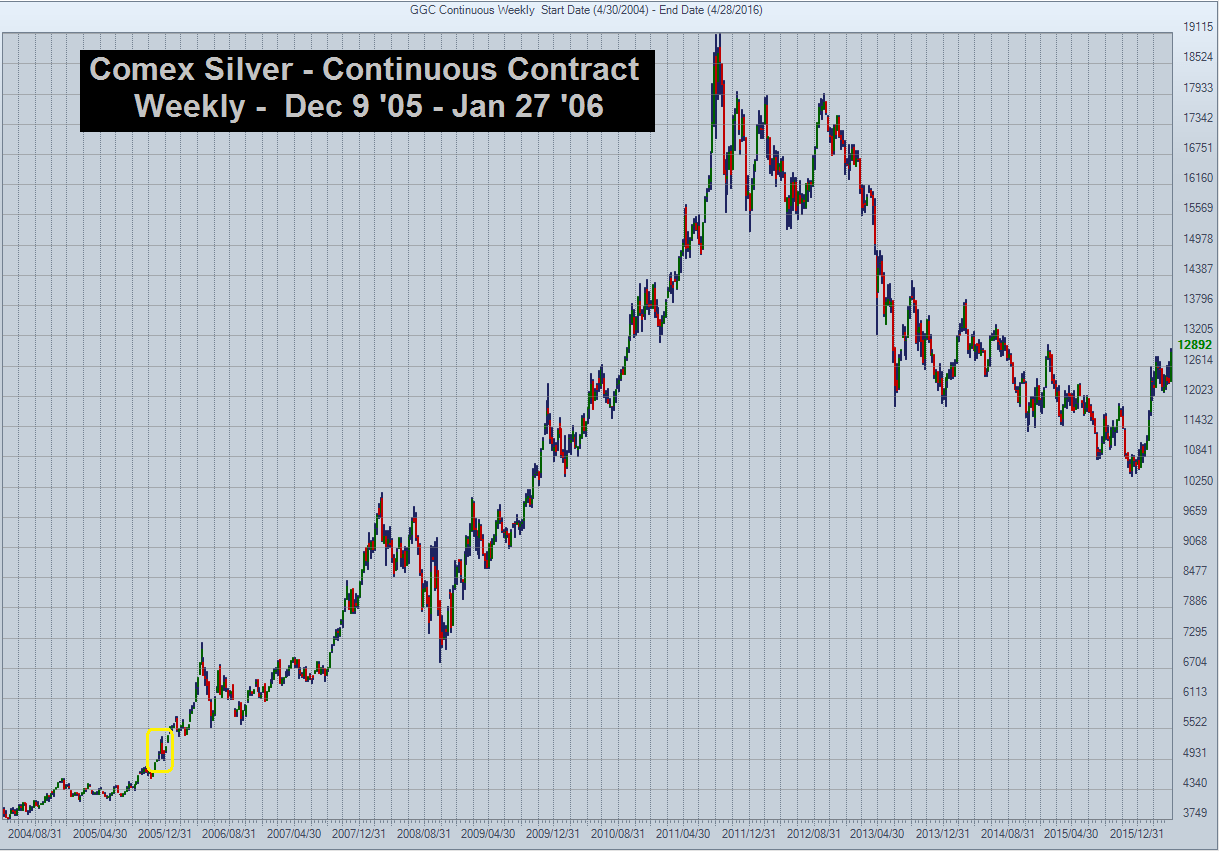
Currently, the bullion bank short interest as a percentage of total open interest in silver is 71%. But the highest this ratio has been going to April 2005 is 82%. The average short interest as percentage of total o/i over the time period is 63%. Now here’s the shocker: the highest the short interest as percentage of o/i has been is 82% . In fact, from the week ending December 9, 2005 to the week ending January 27, 2006, the short interest as a percentage of total o/i ranged between 78% and 82%.
For the week ending December 9, 2005 thru the week ending January 27, 2006, the price silver trade from $5.27 to $5.59 (click on graph to enlarge). In other words, during a period of time when the relative short position of the bullion banks in relation to the total open interest was at its all time high, the price of silver moved up 37 cents, or 6%. And there was a violent price take-down in silver (and gold) but that did not occur until mid-May 2006.
Quite frankly I am as guilty as anyone out there in the obdurance of my view that a price correction bullion bank price take-down is imminent.
Too be sure, at some point there will be a hefty pullback in the precious metals market – nothing goes straight up. But anyone who asserts that the market is not manipulated by the bullion banks and the western Central Banks is either disingenuously persuaded by ulterior motives or is a complete idiot.
Make no mistake, in the context of the massive price manipulation of gold and silver that has occurred over the past 5 years, it’s become infinitely more difficult – as if it isn’t hard enough as it is – to use historical measurement devices in order to make educated guesses on the next directional move in any of the financial markets.

