On Wednesday the Federal Open Market Committee announced it was further reducing it's "QE 3" asset purchase program by another $10 billion a month. A key takeaway in the statement:
"The Committee continues to see the improvement in economic activity and labor market conditions over that period as consistent with growing underlying strength in the broader economy. In light of the cumulative progress toward maximum employment and the improvement in the outlook for labor market conditions, the Committee decided to make a further measured reduction in the pace of its asset purchases."
The entire statement can be read here.
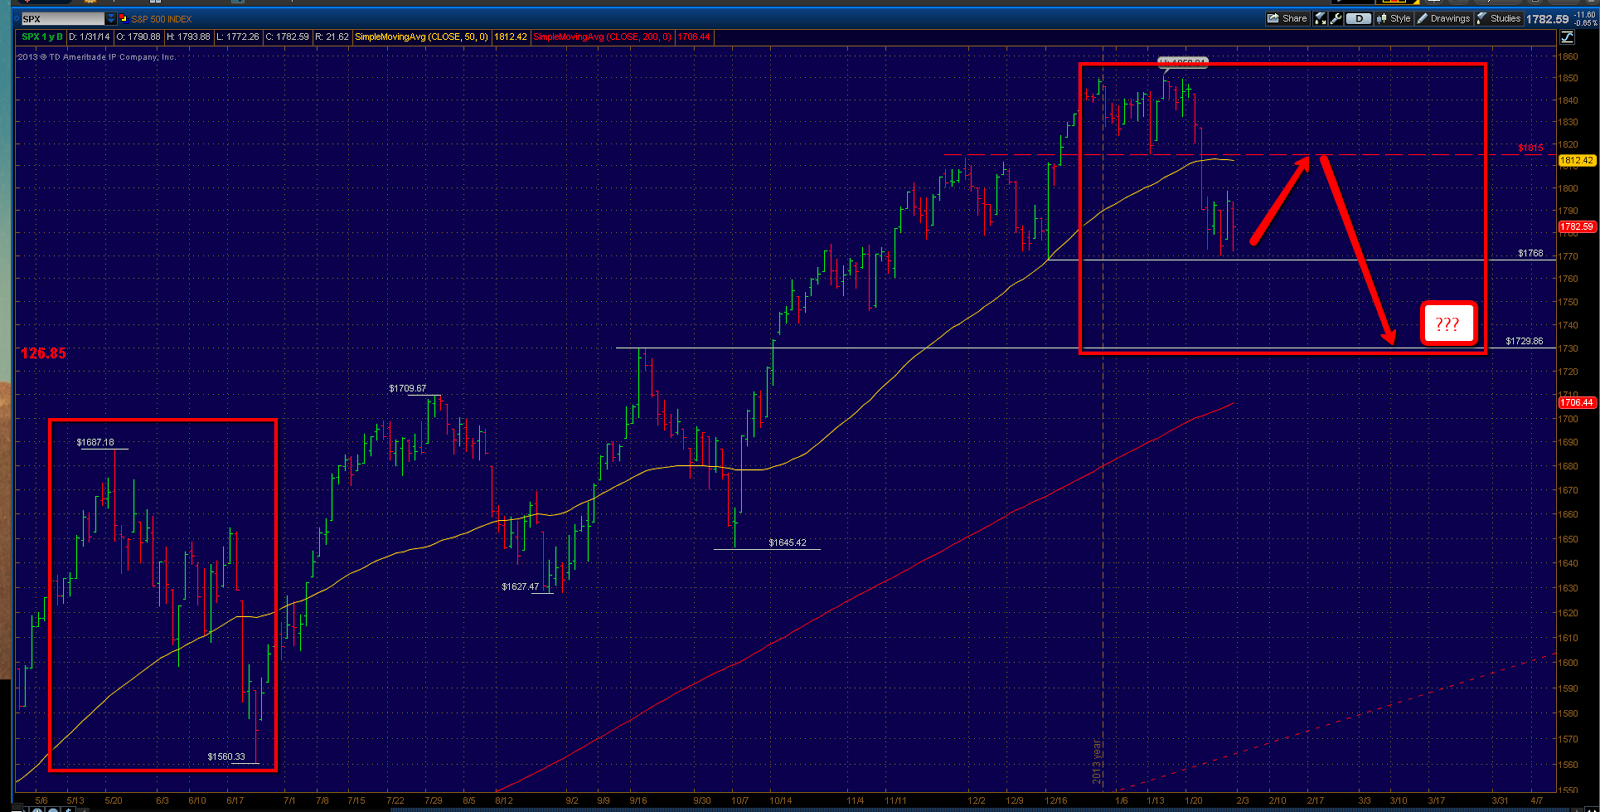
In last week's post we talked about the significance of 1768 in the S+P 500 and that turned out to be the key support level for the week as traders and investors defended it. Resistance now stands at 1815 and the next support level below is 1730, which would then match the size of the biggest correction of 2013. (Depicted on above Chart)
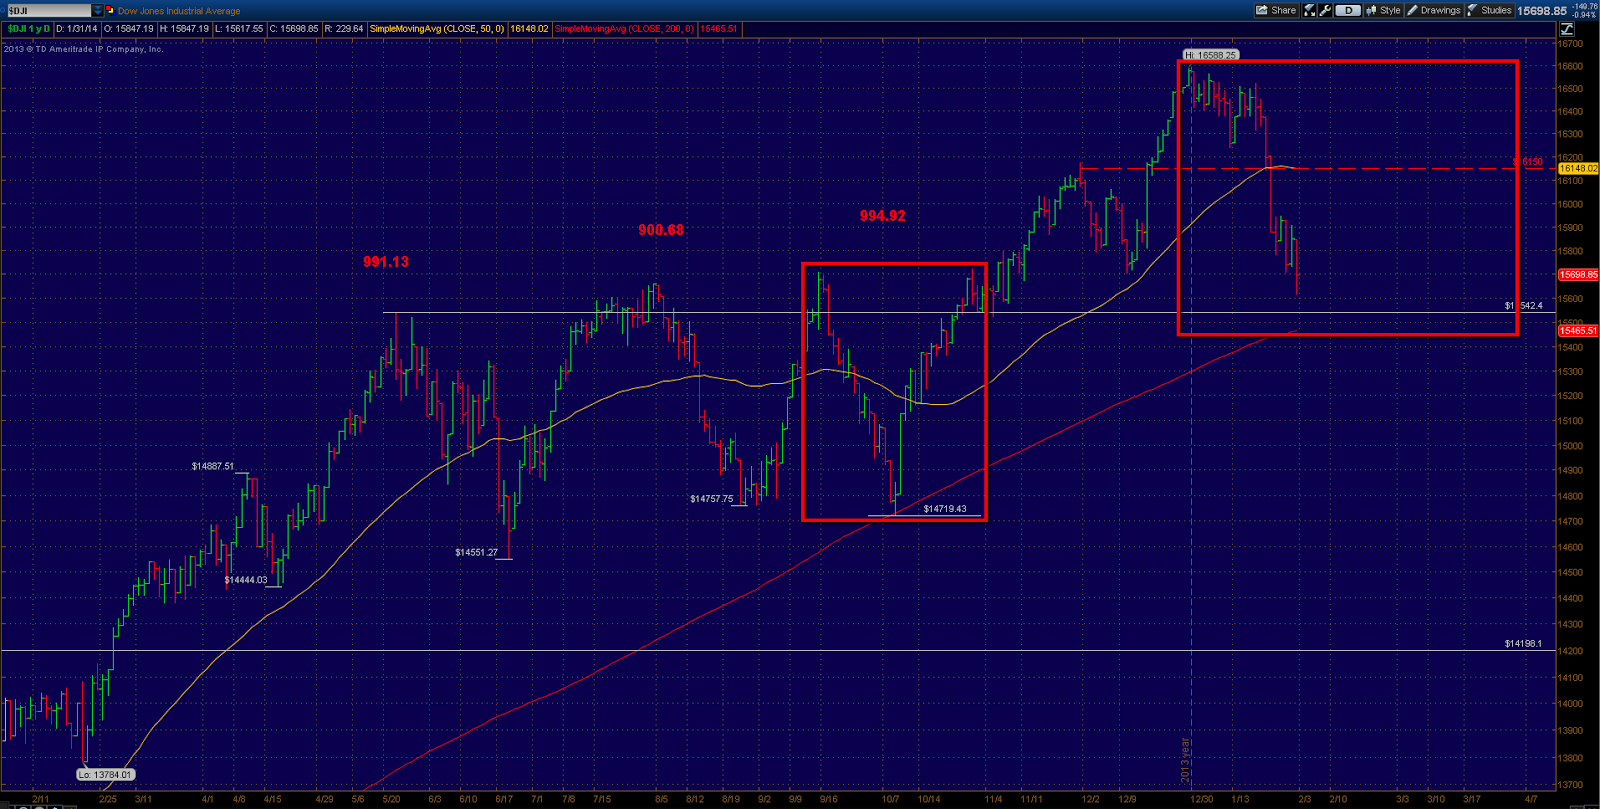
The Dow has been the biggest under-performer for 2014 so far, as we will see later. It is much closer to it's 200 day moving average and support zone than the others. Resistance comes in around 16,150.
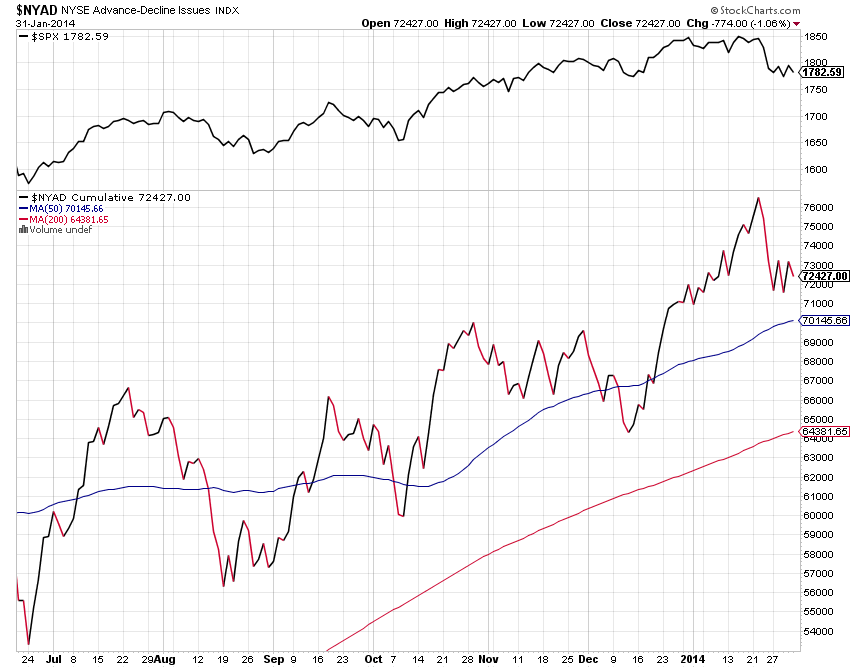
The advance - decline line continues to hold it's uptrend in light of the year to date equity performance. It's ironic because much of 2013 consisted of bearish divergences in this indicator while stock prices continued to make new highs. Now it appears the roles are reversed for the moment.
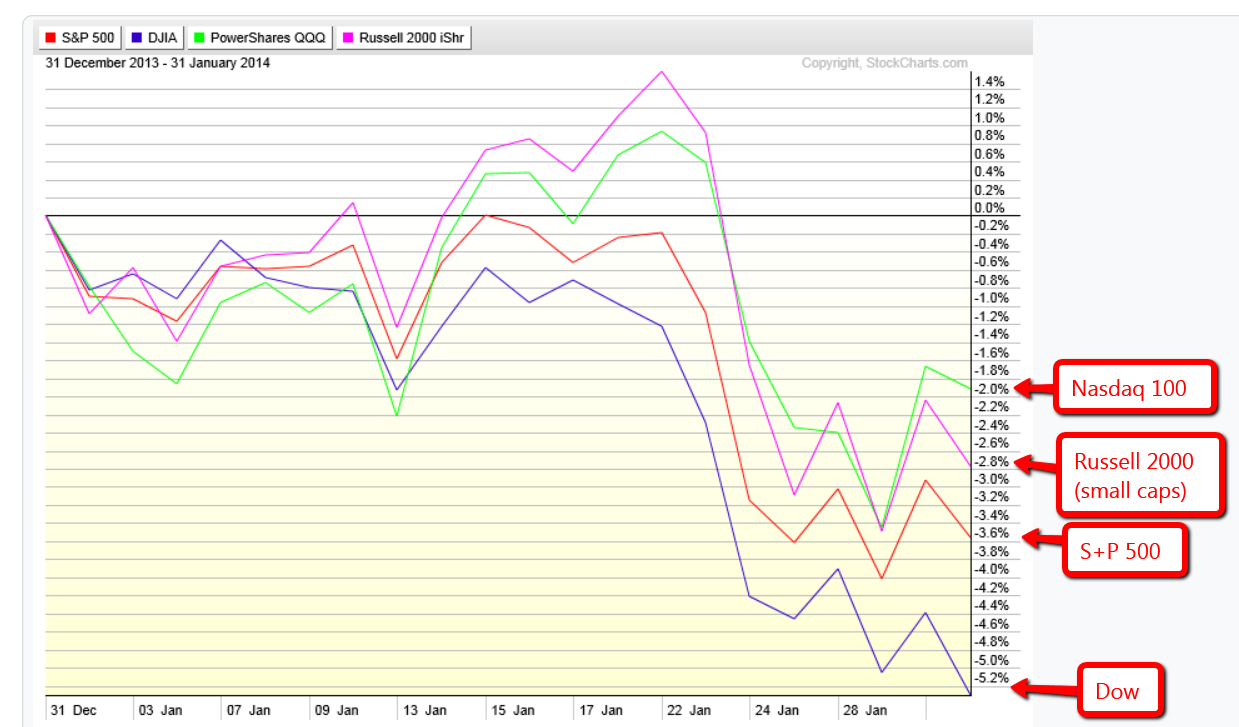
The year to date performance of the four major market averages all show loses, with the Dow Jones Industrial Average coming in as the biggest loser. While the Nasdaq 100 has lost the least.
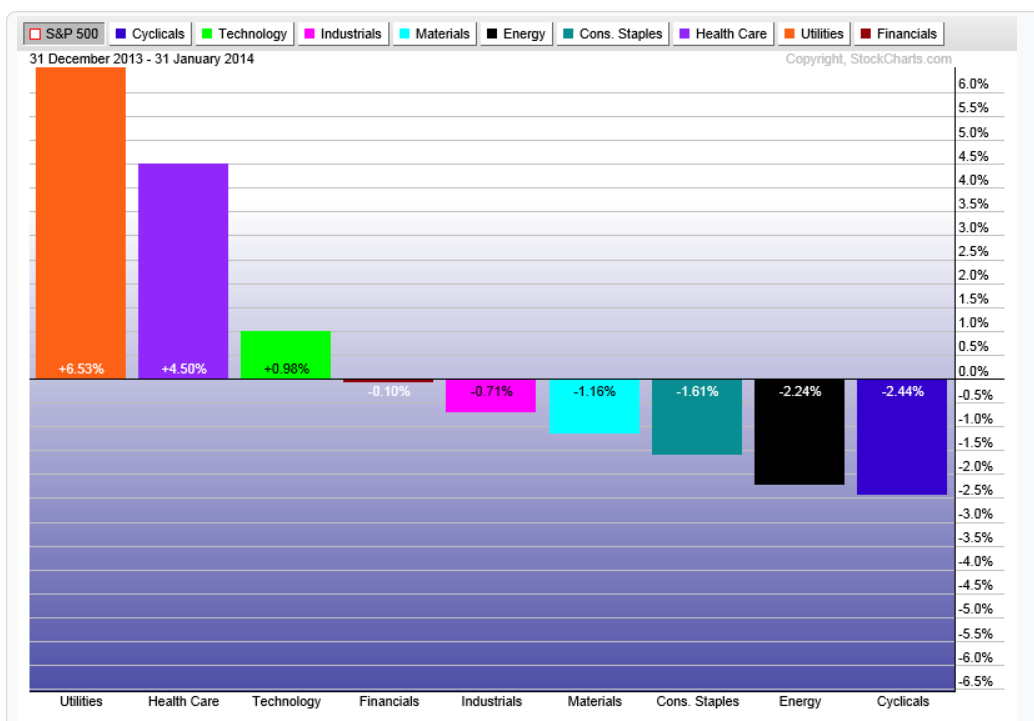
Year to date performance by sector shows Utilities and Health Care as the top performer and Cyclical and Energy as the under-performers as the risk off theme persists.
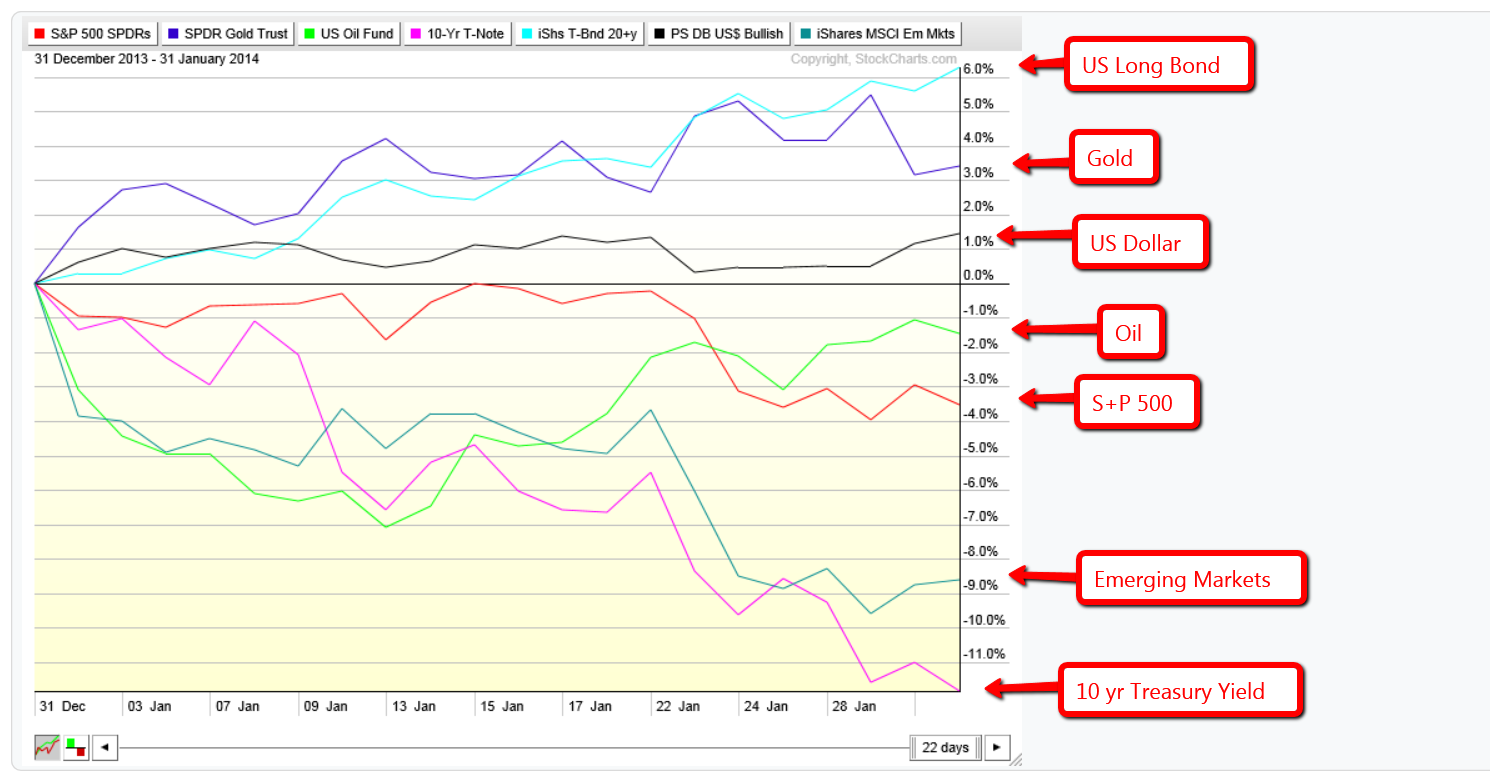
Year to date performance by asset class also drives home the risk off theme as Bonds, Gold and the US dollar continue to outperform while 10 year yield, emerging markets and the S+P 500 round the bottom of the list.
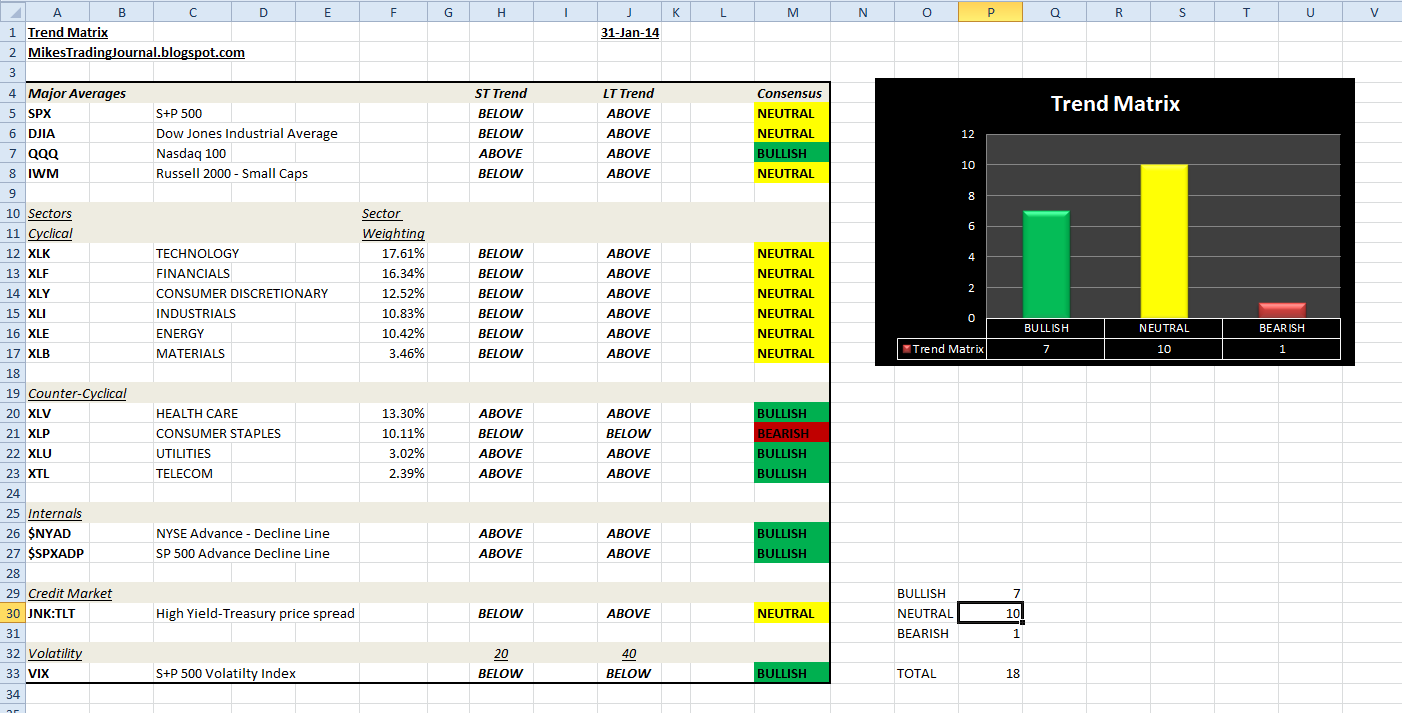
This week's changes in the Trend Matrix consist of the Consumer Staples (XLP) sector turning bearish. The Russell 2000 small caps (IWM) turned from bullish to neutral.
In conclusion we should expect some sort of short term relief rally in equities in the near term. The resistance levels in the major averages will prove whether the short term trends can continue upwards or setup into another leg downward.
Disclaimer: This website was created for entertainment and educational purposes only. Any opinions and analysis expressed anywhere on this site are for educational and entertainment purposes only, and ARE NOT guaranteed in any way. In no event shall Mikes Trading Journal and everyone involved, have any liability for any losses incurred in connection with any decision made, whether action or inaction, upon the information provided on this web site.
Nothing on this site should be misconstrued as investment advice. Trading and investing is very risky, please consult your investment advisor before making any investment decisions.
3rd party Ad. Not an offer or recommendation by Investing.com. See disclosure here or
remove ads
.

