Markets are focusing on the US economic data flow and the latest musings from the ECB.
ECB
Draghi did more to cloud the picture, rather than provide any clarity into the ECB thoughts. Allowing committee members more breathing room, which offers more opportunity to view the market reaction to the ECB tapering “sounding balloon“ floated last week. However, I would not construe the Central Bank's unwillingness to pre-commit to a March 2017 QE extension as tolling the bell for a gradual reduction in QE, either.
Overall, I expect the ECB will announce an extension of the EUR 80bn QE program in December, while adjusting the PSPP parameters to include more eligible bonds by removing the self-imposed yield floor constraint. Draghi explicitly highlighted the bond scarcity issue in his post-ECB remarks, according to journlists at the press conference.
The US Economic Data
USD existing home sales rose 3.2% to the 5.47mn figure, better than the 5.33mn expected in September,reversing most of the negatives from the horrible housing starts data the day before.
The index of leading economic indicators also rose, in line with expectations at 0.2% in September. The biggest positive contributor to the leading index was building permits at 0.19.
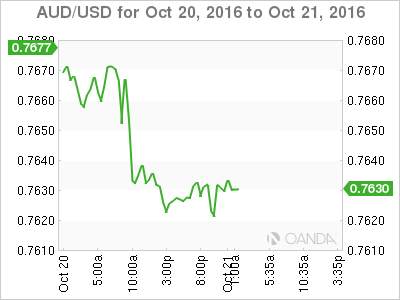
From the penthouse to the outhouse in a mere 24 hours. The Australian dollar was clearly the worst performer in G-10 overnight as the stars quickly misaligned. The primary catalyst was the Domestic Labour report where the Headline did not look all too bad, but the struggling proof was in the pudding as part-time jobs gaining 43.2k, but full-time employment dropped an eye-watering -53.0k.
Adding, fuel to the fire the USD turned “bid-mode” across the board post-ECB and with US existing home sales ballooning to 5.47 million, much better than expected, the USD remained firm throughout the NY session. While the stronger dollar added to commodity price woes, copper and gold especially struggled, undoing much of the firm momentum from previous day positivity. Also, the weaker CNH is not helping matters from a regional perspective.
As a result, the AUD/USD is again looking susceptible especially from the technical point of view after once again failing to hold on to the .77 handle in a trifling 18 hours

As a side note on the Commonwealth currencies: CAD is sure to be in focus tonight with high-risk data on the menu – CPI for September and retail sales for August. Following an August pullback, the CPI is expected to bounce 0.2% which projects via higher energy prices. With Poloz's comments yesterday suggesting more data is required before cutting rates, the market should be hypersensitive to this report as the “ loonie” approaches the critical 1.3250 point.
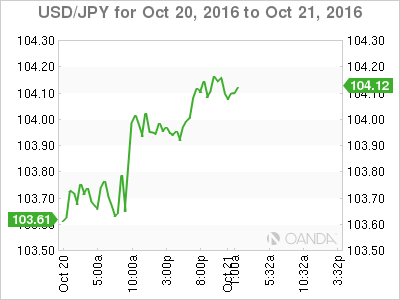
Both the ECB and buoyant existing US home sales were the catalyst for a reversal of the previous days grind lower. However, more so the US data as all things related to US interest rates are currenlty the key driver behind USD/JPY. So sad is the case that the market resorts to chasing this high-frequency data in the absence of a decisive Federal Reserve Board.

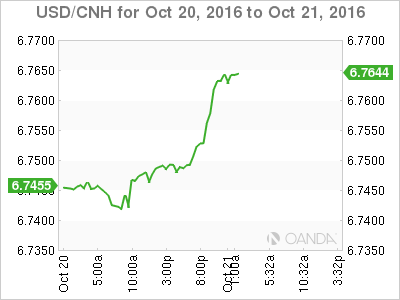
It appears my 6.75 USD/CNH “line in the sand theory“ should be challenged today, as the PBOC’s currency quandary unfolds. Lower exports scream for a weaker currency, yet capital controls to curb outflow say, “not so fast”. Propelled by the strong USD overnight, the offshore yuan is pressing against the critical 6.75 level.
I suspect traders will likely test the waters to check the state-owned bank’s resolve, who are rumored to be on offer. However, it is just a matter of time we move higher as depreciation pressures will continue to build into year end with short-term pressure mounting, as corporate demand for the dollars is on the rise to repay debt or expand overseas operations.

For MYR, watch carefully as PM Najib delivers the 2017 Budget to parliament on Friday. He has announced the major themes, and so USD/MYR may just trade in the range of 4.16-4.2250.
Debate and Beyond
The muted reaction to the debate indicates that the market has bigger fish to fry than poll gazing. Predictably, local Hedgers and the wise bought the USD/MXN dip post-debate, so much for the affectionately tagged “Tumpometer” (Mexican peso as a gauge of the election debate winners).
Traders are quickly turning off election polls and getting on with the job at hand by switching focus to next week’s US 3Q advanced GDP. In my mind, the GDP report could be the agitator that collapses this current USD gridlocked range trade play.
Recall the market’s reaction to July’s soft Q2 GDP print, given the proximity of the all-important December Fed meeting it, could be critical in the Fed Hike debate. While I still maintain the barrier to a December Fed hike is very low, it is only October after all and given just how overly data dependent this current sitting fed membership is, things can change quickly.
