Shareholder distributions come in two varieties: stock buybacks and dividends.
Both are important. Our purpose here is not to debate whether one form of capital management is superior to the other.
We will, however, identify a trend that should worry every investor, not just income seekers: the rising level of unsustainable distributions.
When assessing the sustainability of a company’s dividend payment, we usually focus on its payout ratio – the percentage of free cash flow (FCF) paid out in the form of dividends.
At Wall Street Daily, we prefer a payout ratio under 80%. Anything above 100% is a dire warning.
With that in mind, I calculated my own version of the payout ratio for the S&P 500 (excluding financials) to assess the sustainability of today’s distributions. The results aren’t pretty.
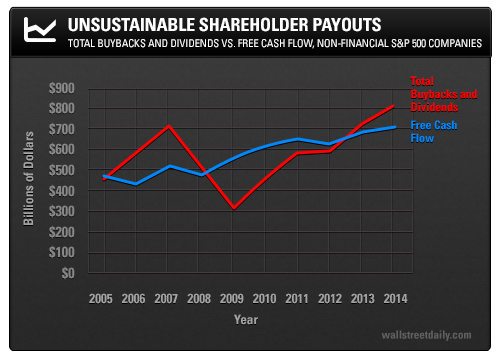
Below is a chart tracking free cash flow versus shareholder distributions over the last decade:

As you can see, distributions have exceeded free cash flow for the last two years. Indeed, dividend payouts and buybacks are at their highest levels ever. In short, we’re on a dangerous trajectory.
The pitfalls here should be obvious. As income investors, sustainable (and growing) dividends are the most important factor in our investments. But as buybacks and dividends exceed free cash flow, companies end up borrowing from the future to pay shareholders today. Which means that at some point down the road, cuts are coming.
Simply put, the current gap between distributions and FCF will have to be evened out. Companies can’t keep increasing their net debt indefinitely.
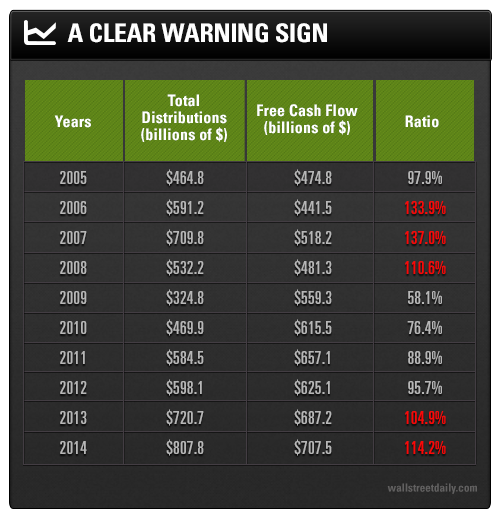
To put today’s distributions in perspective, just look at the chart below, which includes my own de facto payout ratio. As you can see, we’re approaching the payout levels seen just prior to the 2009 crash:

This should scare just about every investor out there. We simply can’t continue at the current pace.
If there’s one takeaway here, it’s that we must be more careful than ever when selecting our income investments.
Many of the stocks on the S&P 500 have trailing 12-month payout ratios well over 100% and should be avoided. This includes big names such as Philip Morris International (NYSE:PM), 110%; Costco (NASDAQ:COST), 148%; Exxon Mobil (NYSE:XOM), 212%; and General Motors (NYSE:GM), 214%.
Bottom line: At some point in the future, distributions have to slow down, meaning dividends that can’t be covered by free cash flow and buybacks funded by debt are major red flags.
Good investing,
by Chris Worthington
