Markets and stock continued to show some strength, albeit slowly.
We continue to march higher and higher regardless of the many people calling for a correction.
While a small pullback would be great, the simple amount of skepticism tells us that there is a ton of cash on the sidelines waiting to come in.
We may have gotten the spark needed to suck in some of that money Friday when China cut interest rates.
As for the metals, they remain strong and moving of lows although it has been a bit of a wild ride, which always brings out the regulars who just love to tell me I’m wrong.
I didn’t bother writing them back Friday after Wednesdays large decline was erased and bested...
The markets try to shake as many people out as they can and Wednesday sure did do that but once the day was done, all gold did was test and hold the breakout level which is a strong sign.

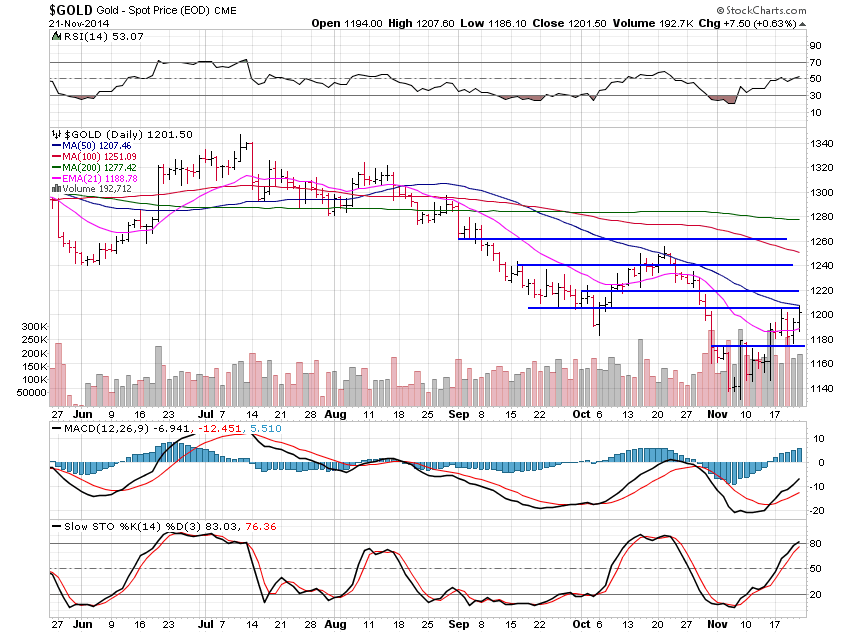
Gold ended the week up 1.14% and is moving well, as I’d said it should.
Let’s keep it simple
Gold is moving slowly higher off lows and moving nicely between support and resistance areas, building consolidation along the way, which is need to form a base to move higher off of.
Resistance levels fall every $20 up to $1,260 marked on this chart but beyond to at least $1,340 just from what I can see on this 6 month chart.
All in all, good stuff and we are still long some gold via an ETF that represents certain miners and so far, so good.
I’m not really yet sure if a major low is in place, but this low is holding great for now.
A break under$1,180 would have to make me change that view.

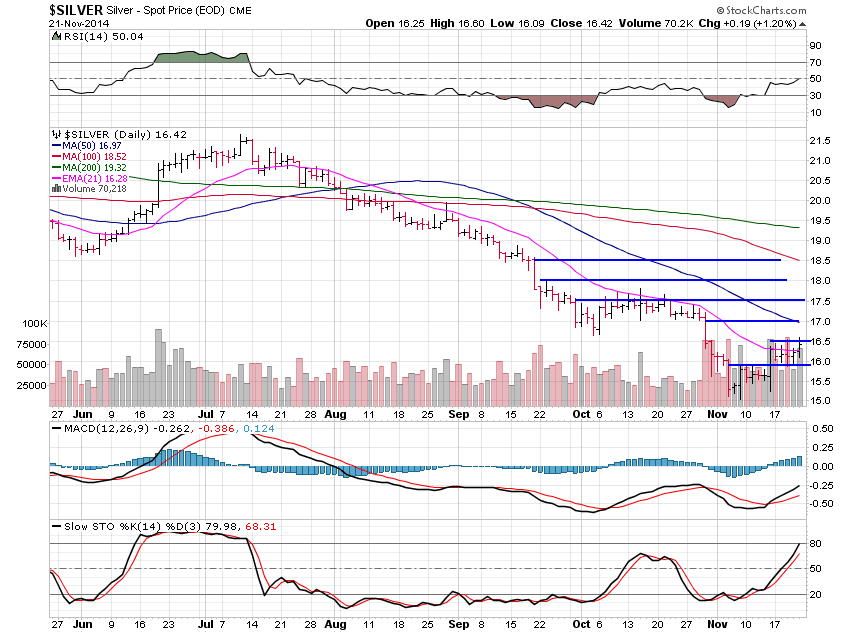
Silver rose 0.74% for the week and is now following golds lead.
Silver has resistance every 50 cent on the way up and looks good for higher.
I’m not too interested in miners at the moment except a select few I talk about with subscribersbut that could change if miners take up a good chunk of the money that is sitting on the sidelines and it will not be hard at all to tell if and when this does happen, and so far it hasn’t.

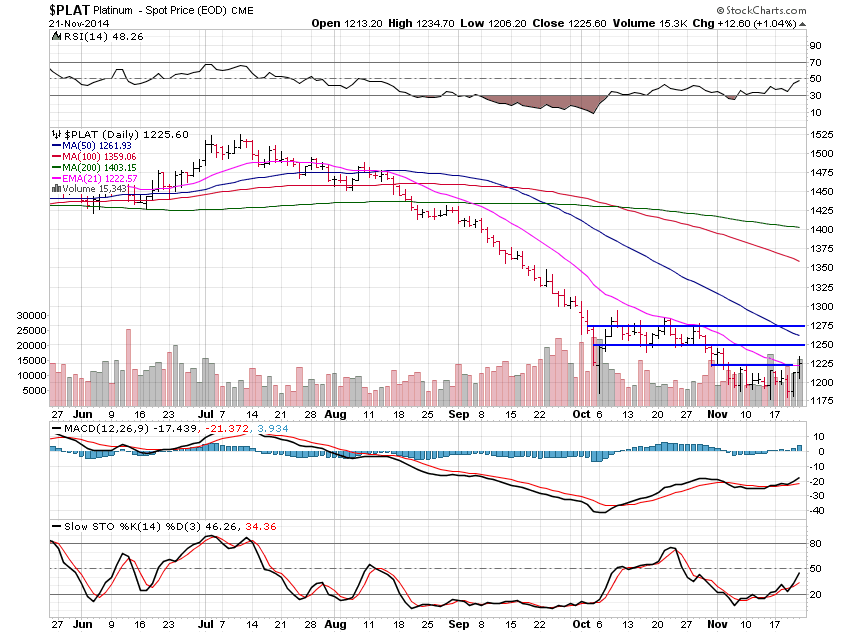
Platinum gained 0.80% on the week and is building a nice base/platform to move up off of anytime now.
$1,250 then $1,275 are next and then there really isn’t much to hold it back from moving to the $1,450 level and I will talk about that as it is happening in the weeks ahead.

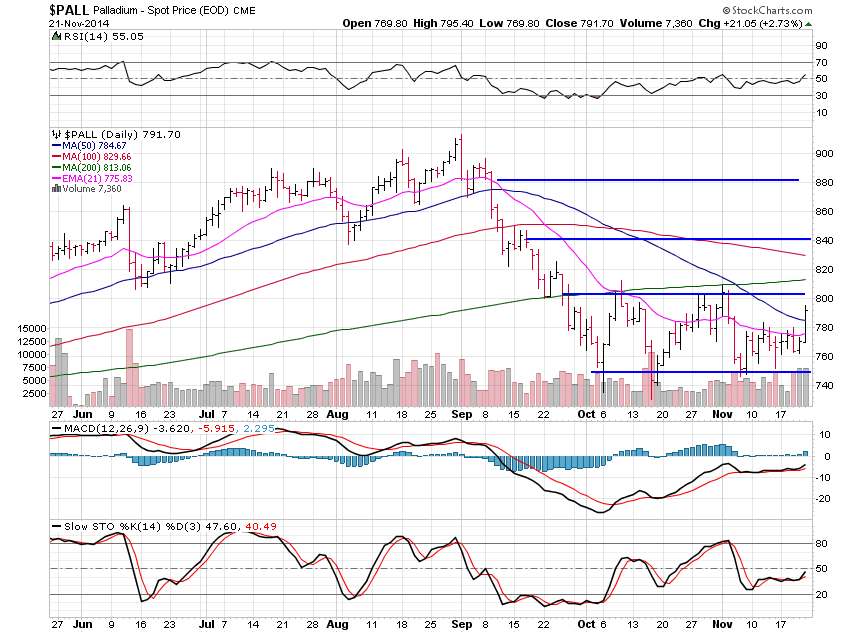
Palladium gained a solid 3.29% this past week and is moving very nicely inside a super looking flat base.
This base could last quite sometime but it won’t.
Once gold moves higher, this base will be broken and a break of $800 could be bought with $840, then $880 as target or resistance areas.
All in all, the metals continue to look great no matter what you or I say.
I can be wrong, but the charts are telling me I’m not, and that is all I do here.
I do not provide a wild opinion or half truth, I just tell what the chart tells me and it continues to be a nice story.