What do these 10 companies – Wal-Mart (NYSE:WMT), Macy`s Inc (NYSE:M), Kohl`s Corporation (NYSE:KSS), Sears Holdings Corporation (NASDAQ:SHLD), Target Corporation (NYSE:TGT), Best Buy Co Inc (NYSE:BBY), Office Depot Inc (NASDAQ:ODP), K-Mart, JC Penney Company Inc Holding (NYSE:JCP), Gap Inc (NYSE:GPS) – all have in common? Each one of them is closing down a slew of retail storefronts.
The “talking heads” on CNBC want you to believe that brick-and-mortar woes are merely a reflection of the consumer’s preference to shop online. Maybe. Or perhaps shuttering the doors will help boost the bottom-line profitability of retail company shareholders. After all, the SPDR S&P Retail (NYSE:XRT) has bounced an astonishing 17.5% off its bear market lows.
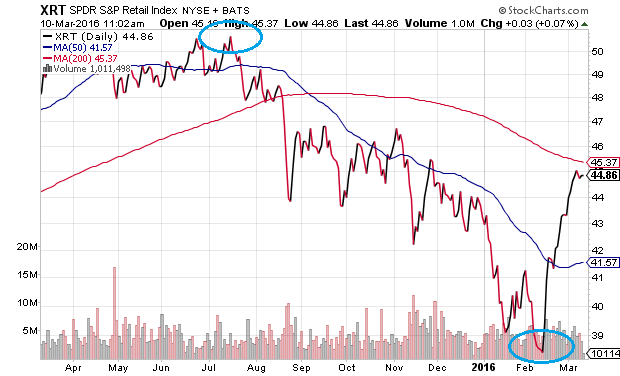
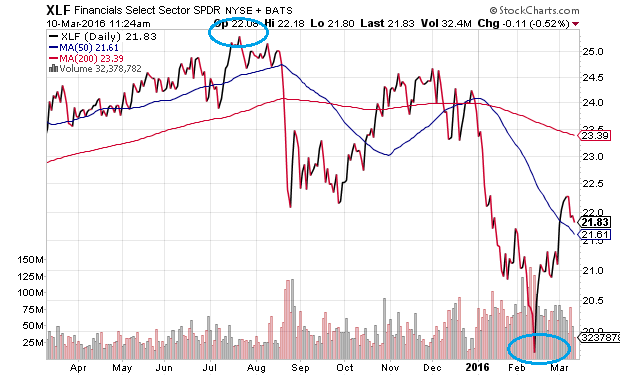
On the other hand, a 24.5% bearish descent for the retail segment does not reflect positively on the well-being of American business. In fact, many influential sectors of the U.S. economy have already descended more than a bearish 20%. There have been peak-to-trough declines ranging from 20%-40% in energy, materials, transporters, biotechnology as well as financial institutions. The bear market rally in Financial Select Sector SPDR (NYSE:XLF) still leaves the influential sector in correction territory, roughly 12% beneath its July pinnacle.
Perhaps ironically, the business media excitedly embraced the 7th birthday of the bull market yesterday (3/9/16). What was missing from the exuberance? The S&P 500 traded at 1989 back in July of 2014. That’s 20 months ago. More critically, 42% of S&P 500 components remain mired in bear market territory, even after the 10% bounce off of the February lows. And what if the S&P 500 should ultimately drop 20% prior to reclaiming its May 2015 record high of 2130? In that case, the bull market would have ended ten months ago at an age of six years, two months.
Not surprisingly, the very same folks who believed the bear market was unstoppable at the February lows – S&P 500 at 1829 – shifted back to the bull camp the minute the S&P 500 closed above 2000. Did the fundamental backdrop on three consecutive quarters of declining earnings per share (EPS) change to justify the bullishness? Hardly. Hadn’t they ever seen how bear market rallies work? Where broad market gauges could jump 10%, 15%, even 18% in the middle of a bearish downtrend? Apparently not.
In spite of the bullish refrain that you have to invest in stocks because there is no alternative (T.I.N.A.), investor preference for intermediate-term treasury bonds demonstrates otherwise. The Federal Reserve is raising its overnight lending rate; committee members express a desire for gradual stimulus removal. Yet that guidance has done little to dissuade the investment community from embracing low yielding investment grade debt – the kind of capital preservation one might get by selecting iShares 7-10 Year Treasury Bond (NYSE:IEF).
The result? The yield curve continues to flatten. The spread between “10s” and “2s” has fallen to a meager 1%. In fact, you’d have to go back to the start of the Great Recession to witness a similar phenomenon.
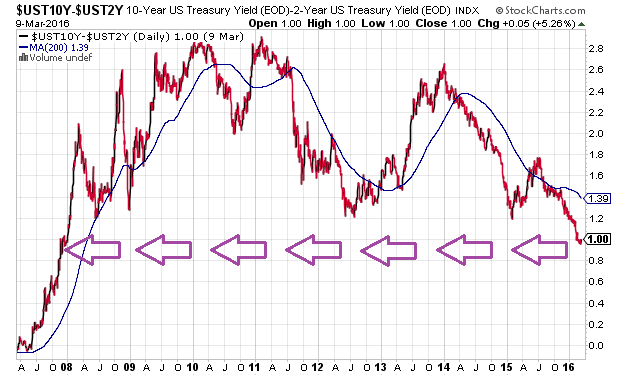
“But Gary,” there is not going to be a recession. “The Federal Reserve won’t make the mistake that it made in 2008 by waiting an entire calendar year before coming to the rescue with asset purchases via electronic money creation (a.k.a. QE).”
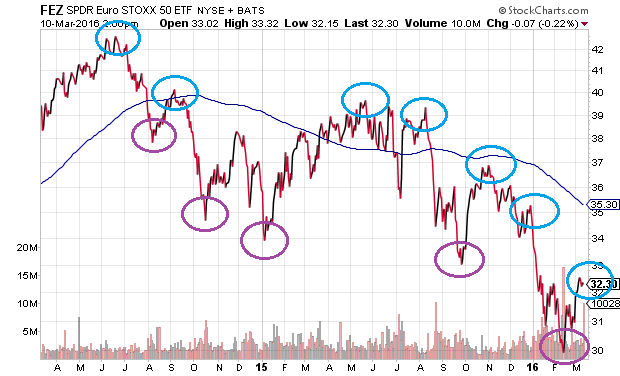
How is that working out for Europe? This morning, Mario Draghi of the European Central Bank (ECB) hoped to kick-start its moribund regional economy by announcing a foray into deeper negative interest rate waters (-0.4%) and committing to $87 billion per month in asset purchases. Not only did global investors sell the news – not only did the SPDR Euro Stoxx 50 (NYSE:FEZ) give up nearly all of its 2% intra-day gains – but the European economy has yet to show genuine improvement from the stimulus policies of the ECB. Consequently, the bear market rallies in Europe have consistently registered “lower highs” and “lower lows.”
Meanwhile, each of the respective BRIC nations (i.e., Brazil, Russia, India, China) are still suffering. There are cracks in Australia’s housing market. And the entire Canadian economy? It has been falling apart on numerous measures.
The hope, then, is that the resilient U.S. consumer will buck the trend of global stagnation. Unfortunately, U.S. corporate profits cannot escape a worldwide demand strike, particularly when 50% of profits come from overseas operations. It seems the resilient U.S. consumer is being asked to carry a whole lot more weight on his/her shoulders than is feasible. With Markit’s U.S. Services PMI hitting a recessionary 49.8 in February – a data point that is at the lowest level in nearly two-and-a-half years – maybe the consumer is getting closer to “tapping out.” 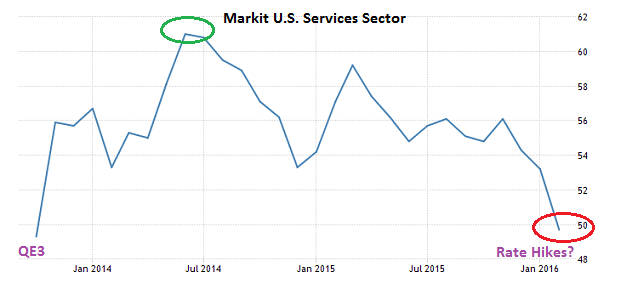
Disclosure: Gary Gordon, MS, CFP is the president of Pacific Park Financial, Inc., a Registered Investment Adviser with the SEC. Gary Gordon, Pacific Park Financial, Inc, and/or its clients may hold positions in the ETFs, mutual funds, and/or any investment asset mentioned above. The commentary does not constitute individualized investment advice. The opinions offered herein are not personalized recommendations to buy, sell or hold securities. At times, issuers of exchange-traded products compensate Pacific Park Financial, Inc. or its subsidiaries for advertising at the ETF Expert web site. ETF Expert content is created independently of any advertising relationships.

