Get 40% Off
⚠ Earnings Alert! Which stocks are poised to surge?
See the stocks on our ProPicks radar. These strategies gained 19.7% year-to-date.
Unlock full list

Market Sentiment: Bullish Institutions Vs. Bearish Individuals

Published 07/29/2016, 02:42 AM
Updated 07/09/2023, 06:31 AM

This week's NAAIM Exposure Index was reported at 101, only the fifth time the exposure index has been reported above 100 since the index's inception on July 5, 2006.

The NAAIM Exposure Index consists of a weekly survey of NAAIM member firms who are active money managers and provide a number which represents their overall equity exposure at the market close on a specific day of the week, currently Wednesday. Responses are tallied and averaged to provide the average long (or short) position or all NAAIM managers as a group.
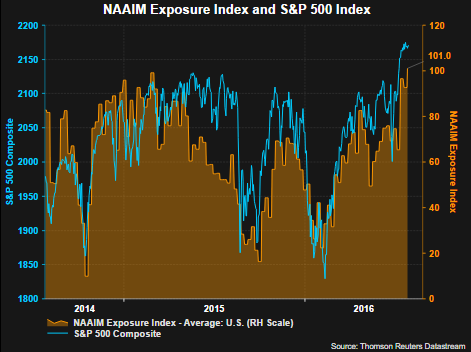
NAAIM Exposure Index

Conversely, today individual investor bullish sentiment, reported by the American Association of Individual Investors, fell four percentage points to 31.3%. This is below the long term average of the bullish sentiment reading of 38.5%.
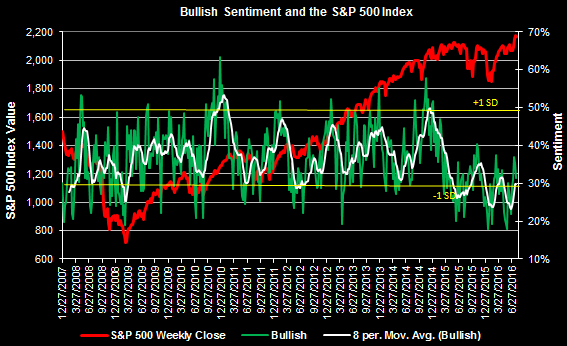
Bullish Sentiment
The individual investor sentiment measure is considered a contrarian one as individual investors tend to be the most bullish near market tops and the least bullish near market bottoms.

So, if this is the case, and institutions tend to be on the bullish or right side of the allocation debate, are these two readings indicating the market has more room to move to the upside?

Below is a table comparing the prior NAAIM readings above 100, the AAII individual bullish sentiment reading and the subsequent one year return for the S&P 500 Index.

Although the number of NAAIM readings is small, the subsequent 12-month return for the S&P 500 Index has averaged a low double digit positive return when NAAIM readings were above 100.
NAAIM Exosure In Excess Of 100%

Lastly, the S&P 500 Index has traded within a very tight 1% trading range for the last eleven trading days. From a positive standpoint, markets can correct in price (a steep decline), or over time.

This sideways trading range may be one where a correction is occurring over time. The obvious questions is whether the market breaks to the upside or to the downside.
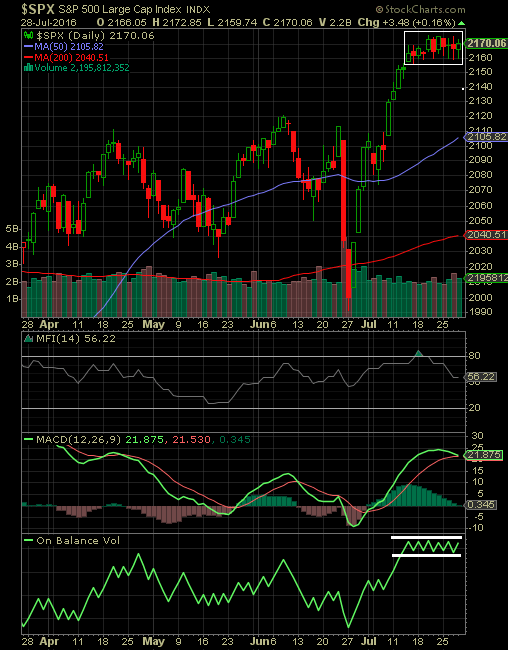
SPX Daily Chart

Additional commentary, and an interesting one, highlighted by Ryan Detrick, CMT of LPL Financial, on the market level and whether or not it is in a bubble can be read in an research report, Is the S&P 500 in a Bubble?.

Latest comments

Bubbles everywhere !
Risk Disclosure: Trading in financial instruments and/or cryptocurrencies involves high risks including the risk of losing some, or all, of your investment amount, and may not be suitable for all investors. Prices of cryptocurrencies are extremely volatile and may be affected by external factors such as financial, regulatory or political events. Trading on margin increases the financial risks.
Before deciding to trade in financial instrument or cryptocurrencies you should be fully informed of the risks and costs associated with trading the financial markets, carefully consider your investment objectives, level of experience, and risk appetite, and seek professional advice where needed.
Fusion Media would like to remind you that the data contained in this website is not necessarily real-time nor accurate. The data and prices on the website are not necessarily provided by any market or exchange, but may be provided by market makers, and so prices may not be accurate and may differ from the actual price at any given market, meaning prices are indicative and not appropriate for trading purposes. Fusion Media and any provider of the data contained in this website will not accept liability for any loss or damage as a result of your trading, or your reliance on the information contained within this website.
It is prohibited to use, store, reproduce, display, modify, transmit or distribute the data contained in this website without the explicit prior written permission of Fusion Media and/or the data provider. All intellectual property rights are reserved by the providers and/or the exchange providing the data contained in this website.
Fusion Media may be compensated by the advertisers that appear on the website, based on your interaction with the advertisements or advertisers.
© 2007-2024 - Fusion Media Limited. All Rights Reserved.