
The Bank of Nova Scotia’s (TO:BNS) shares gained nearly 2% on the NYSE since the company declared its fourth-quarter fiscal 2016 (ended Oct 31) results on Tuesday, before the opening bell. Net income for the quarter came in at C$2.0 billion ($1.5 billion), up 9.1% year over year. Net income for 2016 was C$7.4 billion ($5.6 billion), up 2.1% from the prior year.
A rise in revenues was partly offset by higher operating expenses. Improvement in capital and profitability ratios was impressive.
During the reported quarter, Canadian Banking, International Banking, and Global Banking and Market segments’ net income saw a year-over-year rise of 14%, 9.8% and 41.8%, respectively; while net loss from the Other segment amounted to C$23 million, as against net income of C$117 million in fourth-quarter fiscal 2015.
Revenues & Expenses Depict a Rise
Total revenue for the reported quarter was C$6.8 billion ($5.2 billion), up 10.2% year over year. Higher revenues were driven by a rise in net interest income as well as non-interest income. Total revenue for 2016 was C$26.4 billion ($20.1 billion), up 9.6% from the prior year.
Net interest income came in at C$3.7 billion ($2.8 billion), up 8.4% year over year. Non-interest income was C$3.1 billion ($2.4 billion), up 12.5% year over year.
Non-interest expenses were C$3.7 billion ($2.8 billion), up 11.1% year over year.
Total provision for credit losses was C$550 million ($419.4 million), down marginally year over year. The decline was mainly attributable to the prior year’s increase in collective allowance against performing loans. This was mostly offset by higher provisions in the International Banking segment as well as Canadian Banking.
Strong Balance Sheet
As of Oct 31, 2016, Scotia Bank’s total assets were C$896.3 billion ($683.5 billion), up 4.6% year over year. Consumer loans and acceptances were up 4.9% from the prior-year quarter to C$492.1 billion ($375.3 billion). Deposits came in at C$611.9 billion ($466.6 billion), up 1.8% year over year.
Healthy Capital and Profitability Ratios
As of Oct 31, 2016, Scotia Bank's Common Equity Tier 1 ratio came in at 11.0% compared with 10.3% as of Oct 31, 2015. Further, Total capital ratio came in at 14.6%, compared to 13.4% in the prior-year quarter.
Return on equity for the reported quarter came in at 14.7%, compared to 14.2% in fourth-quarter fiscal 2015.
Dividend Update
Concurrent with the earnings release, Scotia Bank announced a quarterly dividend of 74 cents per share. The dividend will be paid on Jan 27, 2017, to shareholders of record as of Jan 3, 2017.
Notably, management declared two dividend hikes in 2016, increasing the returns to shareholders by 6% during the current year.
Our Viewpoint
A diversified product mix and strong capital position will help Scotia Bank to grow organically as well as through acquisitions. Further, the export-driven economy of Canada is expected to benefit from gradual recovery of the U.S. economy. However, a persistent low interest rate environment along with stringent regulatory reforms, keep us skeptical about the company’s sustainable growth in the long term.
BANK OF NOVA SC Price, Consensus and EPS Surprise
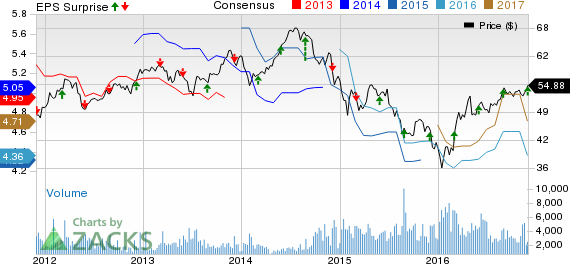
BANK OF NOVA SC Price, Consensus and EPS Surprise | BANK OF NOVA SC Quote
Scotia Bank currently carries a Zacks Rank #4 (Sell).
You can see the complete list of today’s Zacks #1 (Strong Buy) Rank stocks here.
Performance of Other Foreign Banks
Mitsubishi UFJ Financial Group Inc. (NYSE:MTU) reported profits attributable to owners of parent of ¥490.5 billion ($4.67 billion) for the six months (ended Sep 30) of the fiscal year ending Mar 31, 2017, down 18.2% year over year.
The Royal Bank of Scotland Group (LON:RBS) plc (TO:RBS) reported third-quarter 2016 profit attributable to shareholders of £896 million ($1.5 billion) as against loss of £828 million ($1.28 billion) in the prior-year comparable period. Notably, results included litigation and conduct costs of £780 million ($1.3 billion).
Deutsche Bank AG (DE:DBKGn) (NYSE:DB) reported net income of €278 million ($310.2 million) in third-quarter 2016, as against a loss of €6 billion ($6.70 billion) in the prior-year period. Income before income taxes came in at €619 million ($690.6 million), as against a loss of €6.1 billion ($6.80 billion) in the year-ago quarter.
Zacks' Top Investment Ideas for Long-Term Profit
How would you like to see our best recommendations to help you find today’s most promising long-term stocks? Starting now, you can look inside our portfolios featuring stocks under $10, income stocks, value investments and more. These picks, which have double and triple-digit profit potential, are rarely available to the public. But you can see them now. Click here >>
DEUTSCHE BK AG (DB): Free Stock Analysis Report
ROYAL BK SC-ADR (RBS): Free Stock Analysis Report
MITSUBISHI-UFJ (MTU): Free Stock Analysis Report
BANK OF NOVA SC (BNS): Free Stock Analysis Report
Original post
Zacks Investment Research