Get 40% Off
🚨 Volatile Markets? Find Hidden Gems for Serious OutperformanceFind Stocks Now

Saudi Stock Exchange Nearing Resistance Zone

Published 12/29/2014, 03:52 AM
Updated 07/09/2023, 06:31 AM

Saudi Stock Exchange: getting closer to resistance zone that could lead to a pullback

For the past seven days the TASI has rebounded 22.70% from its corrective low of 7,225.83 hit on December 17, with the rally accompanied by increasing volume. That low completed a 35.25% correction off the 11,159.50 peak reached in September (13-week decline). The 38.2% Fibonacci retracement has now been exceeded and the TASI is heading up into a large potential resistance zone, which is likely to turn the Saudi market back down for a re-test of support towards the recent lows.
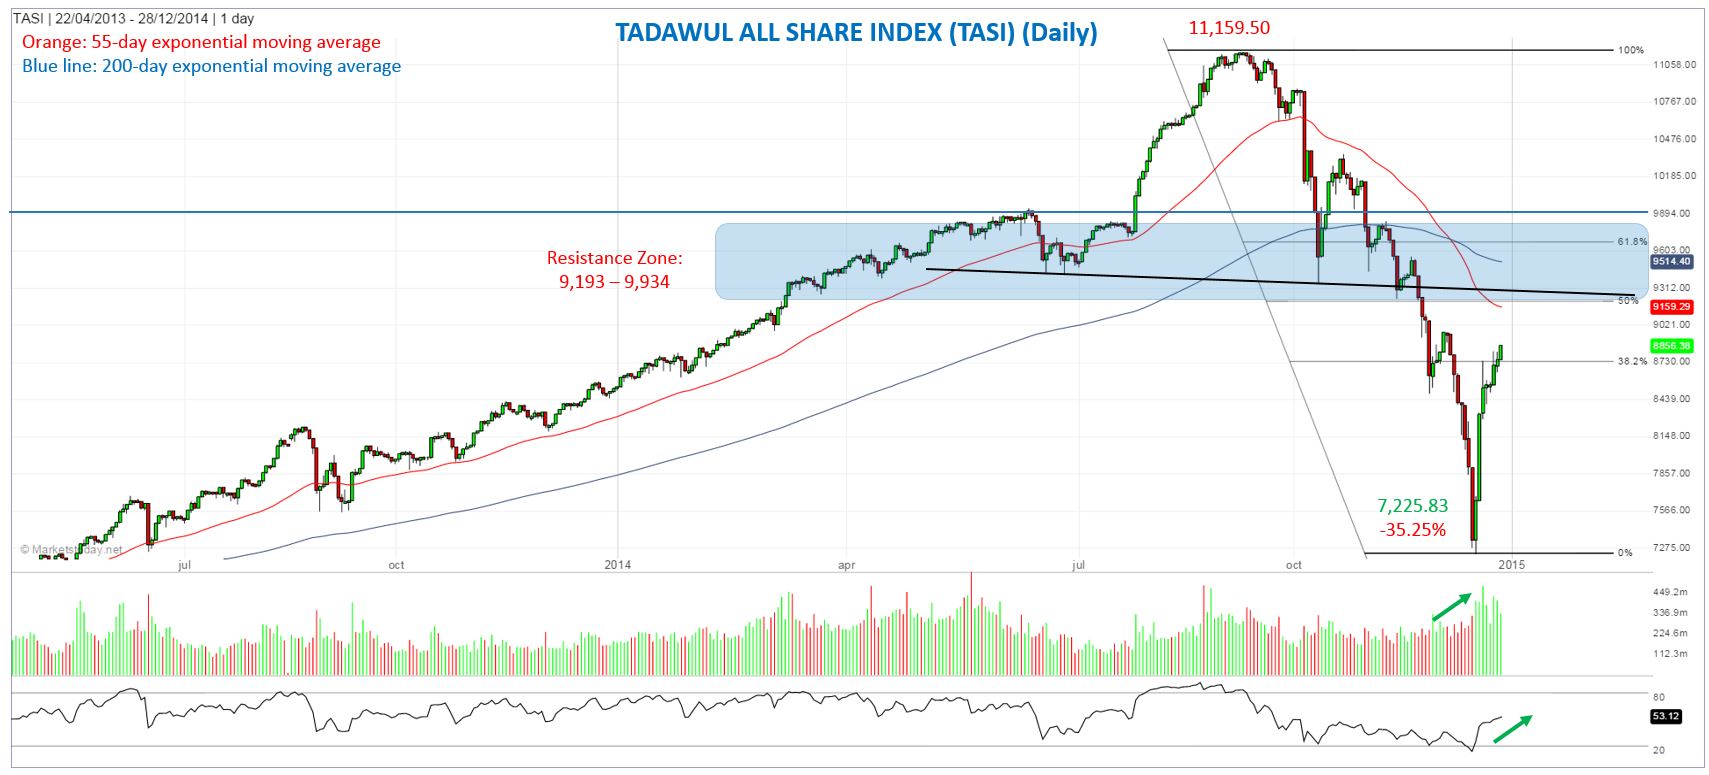
TASI Daily Chart Displaying 55  Day EMA  vs. The 200 Day EMA

During the recent decline the TASI fell well below its 200-week exponential moving average (ema) and its long-term uptrend line, but it managed to finish the week above each, supporting the idea that a bottom has likely been put in. At the same time the 55-day ema has crossed down through the 200-day ema, a sign that the intermediate trend is changing and therefore volatility might remain high for a while longer.
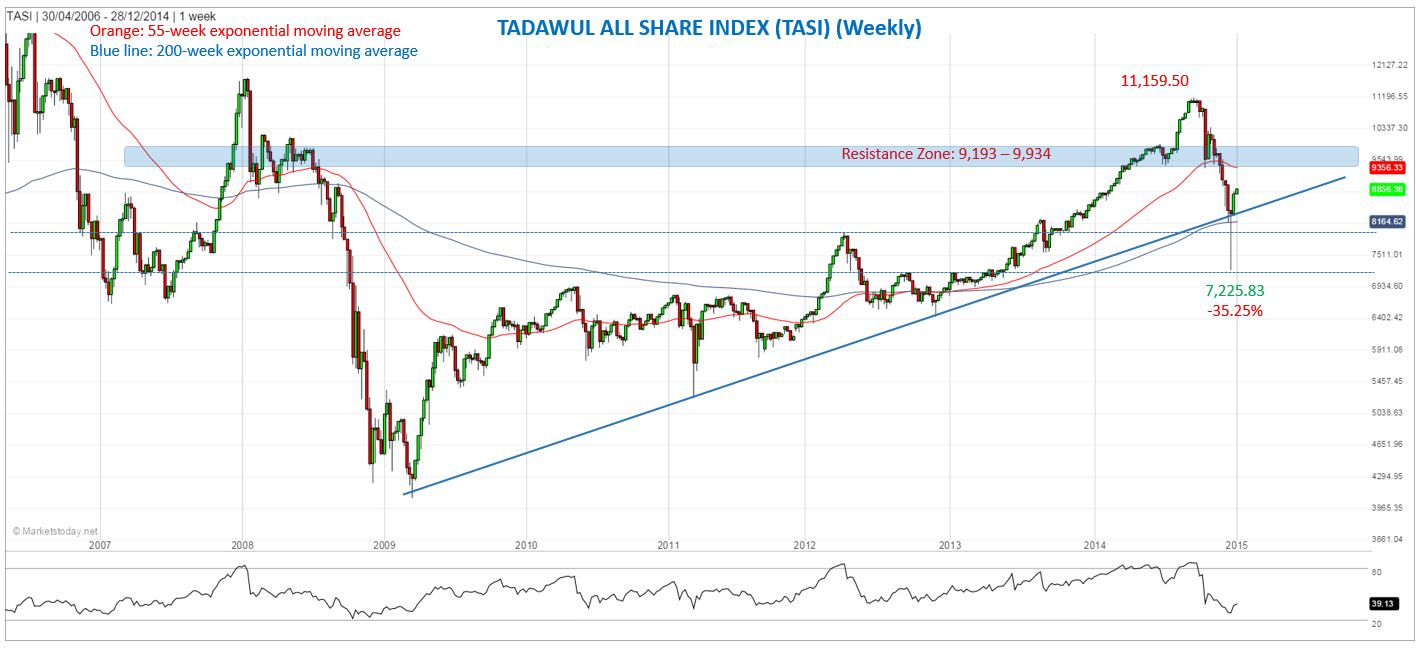
TASI Weekly Chart Displaying 55 week EMA vs. 200 week  EMA

The potential resistance zone is identified from approximately 9,193 to 9,934, consisting of a combination of previous price action, Fibonacci retracement levels and moving averages. Fibonacci levels are at 9,193 (50% retracement) and 9,656.84 (61.8% retracement), while the 200-day ema is at 9,514.40, and the 55-week ema is at 9,356.33. (www.marketstoday.net)

Latest comments

Risk Disclosure: Trading in financial instruments and/or cryptocurrencies involves high risks including the risk of losing some, or all, of your investment amount, and may not be suitable for all investors. Prices of cryptocurrencies are extremely volatile and may be affected by external factors such as financial, regulatory or political events. Trading on margin increases the financial risks.
Before deciding to trade in financial instrument or cryptocurrencies you should be fully informed of the risks and costs associated with trading the financial markets, carefully consider your investment objectives, level of experience, and risk appetite, and seek professional advice where needed.
Fusion Media would like to remind you that the data contained in this website is not necessarily real-time nor accurate. The data and prices on the website are not necessarily provided by any market or exchange, but may be provided by market makers, and so prices may not be accurate and may differ from the actual price at any given market, meaning prices are indicative and not appropriate for trading purposes. Fusion Media and any provider of the data contained in this website will not accept liability for any loss or damage as a result of your trading, or your reliance on the information contained within this website.
It is prohibited to use, store, reproduce, display, modify, transmit or distribute the data contained in this website without the explicit prior written permission of Fusion Media and/or the data provider. All intellectual property rights are reserved by the providers and/or the exchange providing the data contained in this website.
Fusion Media may be compensated by the advertisers that appear on the website, based on your interaction with the advertisements or advertisers.
© 2007-2024 - Fusion Media Limited. All Rights Reserved.