The renowned “Santa Claus Rally” is second only to “Sell in May” in generating a flood of articles from us “market analyst types”. But I haven’t seen too many Santa Claus Rally articles so far this year so I’ve decided to try to beat the crowd. Plus, “rally time” is (hopefully) just a short ways away.
Different “market analyst types” define the Santa Claus Rally time period differently. Here is how I define it:
The “bullish” Santa Claus Rally period extends:
*From the close of trading on the Friday before Thanksgiving;
*Through the end of trading on the third trading day of the next calendar year.
So in this case, it extends from the close on 11/20/15 through the close on 1/6/16.
This begs the obvious question: Should we really be putting any faith in way too simple idea? Let’s let the numbers help you to decide.
The Santa Claus Rally Results
The test below involves holding the Dow Jones Industrials Average only during the time period described above, every year starting in November 1949.
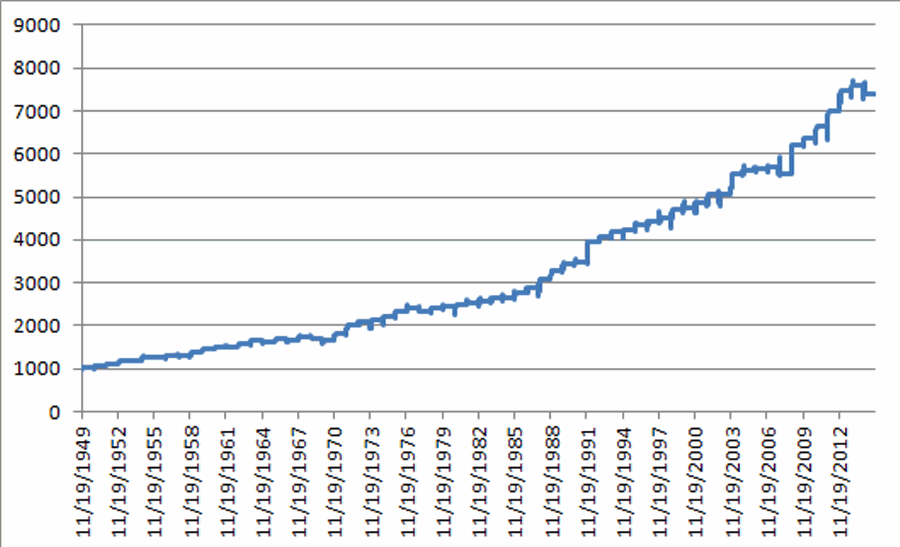
Figure 1 displays the growth of $1,000 on a cumulative basis (no interest is assumed during the times when out of the market).
Figure 1 – Growth of $1,000 invested in the Dow Industrials only during the Santa Claus Rally period each year (11/19/49-11/13/15)
Figure 2 displays the annual results on a year-by-year basis.
| Period Ending | DJIA % +(-) |
| 1/5/50 | 3.6 |
| 1/4/51 | 4.0 |
| 1/4/52 | 3.9 |
| 1/6/53 | 4.6 |
| 1/6/54 | 2.9 |
| 1/5/55 | 5.1 |
| 1/5/56 | 0.2 |
| 1/4/57 | 3.7 |
| 1/6/58 | (0.0) |
| 1/6/59 | 5.7 |
| 1/6/60 | 5.8 |
| 1/5/61 | 3.2 |
| 1/4/62 | (1.0) |
| 1/4/63 | 5.0 |
| 1/6/64 | 5.0 |
| 1/6/65 | (1.2) |
| 1/5/66 | 3.0 |
| 1/5/67 | (0.5) |
| 1/4/68 | 4.3 |
| 1/6/69 | (3.1) |
| 1/6/70 | (2.4) |
| 1/6/71 | 10.0 |
| 1/5/72 | 11.6 |
| 1/4/73 | 3.4 |
| 1/4/74 | 2.0 |
| 1/6/75 | 3.6 |
| 1/6/76 | 6.0 |
| 1/5/77 | 3.1 |
| 1/5/78 | (3.7) |
| 1/4/79 | 3.6 |
| 1/4/80 | 1.6 |
| 1/6/81 | 1.5 |
| 1/6/82 | 0.9 |
| 1/5/83 | 2.3 |
| 1/5/84 | 2.5 |
| 1/4/85 | (0.3) |
| 1/6/86 | 5.7 |
| 1/6/87 | 4.3 |
| 1/6/88 | 6.5 |
| 1/5/89 | 6.2 |
| 1/4/90 | 5.4 |
| 1/4/91 | 0.6 |
| 1/6/92 | 13.9 |
| 1/6/93 | 2.4 |
| 1/5/94 | 2.8 |
| 1/5/95 | 0.9 |
| 1/4/96 | 3.7 |
| 1/6/97 | 1.5 |
| 1/6/98 | 1.8 |
| 1/6/99 | 4.2 |
| 1/5/00 | 1.1 |
| 1/4/01 | 2.7 |
| 1/4/02 | 4.0 |
| 1/6/03 | (0.4) |
| 1/6/04 | 9.5 |
| 1/5/05 | 1.3 |
| 1/5/06 | 1.1 |
| 1/5/07 | 0.4 |
| 1/4/08 | (2.9) |
| 1/6/09 | 12.0 |
| 1/6/10 | 2.5 |
| 1/5/11 | 4.6 |
| 1/5/12 | 5.3 |
| 1/4/13 | 6.7 |
| 1/6/14 | 1.6 |
| 1/6/15 | (2.5) |
Figure 2 – % Gain/Loss for Dow Industrials during Santa Claus Rally period year-by-year
Figure 3 displays the “Summary” results
| Measure | Result |
| Number Times UP | 55 |
| Number Times DOWN | 11 |
| % Times UP | 83.3% |
| % Times DOWN | 16.7% |
| Average % +(-) All Yrs. | 3.24% |
| Average % +(-) UP Yrs. | 4.08% |
| Average % +(-) DOWN Yrs. | -1.62% |
| Best Up Year (1991-92) | 13.90% |
| Worst Down Year (1977-78) | -3.70% |
Figure 3 – Santa Claus Rally by the numbers
Summary
In a nutshell, over the course of the previous 66 years the Santa Claus Rally time period has witnessed the Dow generate 83% winners with an average win/average loss ratio of 2.5-to-1.
*The good news is that that is a pretty darn good, “real-time” track record.
*The bad news is that there is no guarantee that Santa will come through for us this year.
Folks, now more than ever, “We have got to believe!!”
