Get 40% Off
🚨 Volatile Markets? Find Hidden Gems for Serious OutperformanceFind Stocks Now

S&P: A Market Bounce Likely

Published 10/02/2014, 02:31 AM
Updated 07/09/2023, 06:32 AM

In the market Wednesday the selling intensified across all the Stock Market Indexes leaving the closing deep in the red. Before I address a situation in the VIX chart that will be in play the next couple of days, I believe it is time to stand back and take a look at the long term charts of the S&P.
S&P - 35 Years

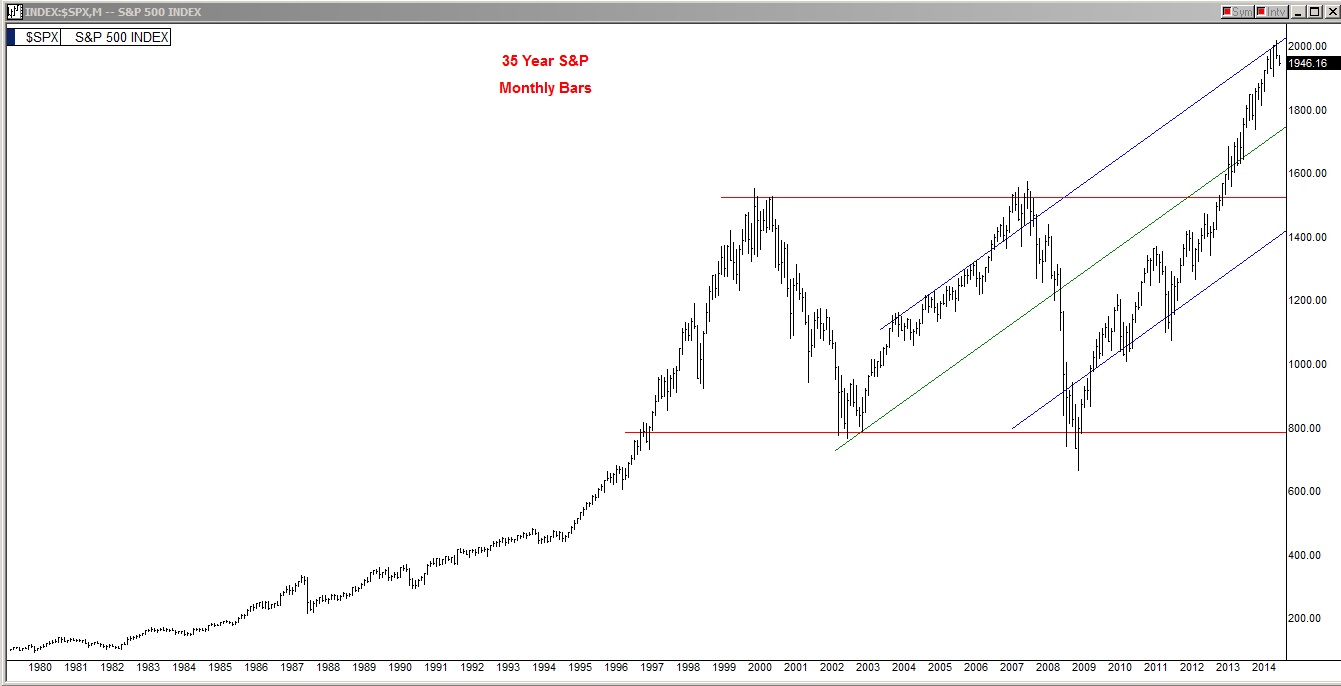
The first chart shown is the 35-year chart of the S&P using monthly bars showing how the past two months we finally maxed out on the incredibly steep 6-year blue channel.
S&P - 12 Years

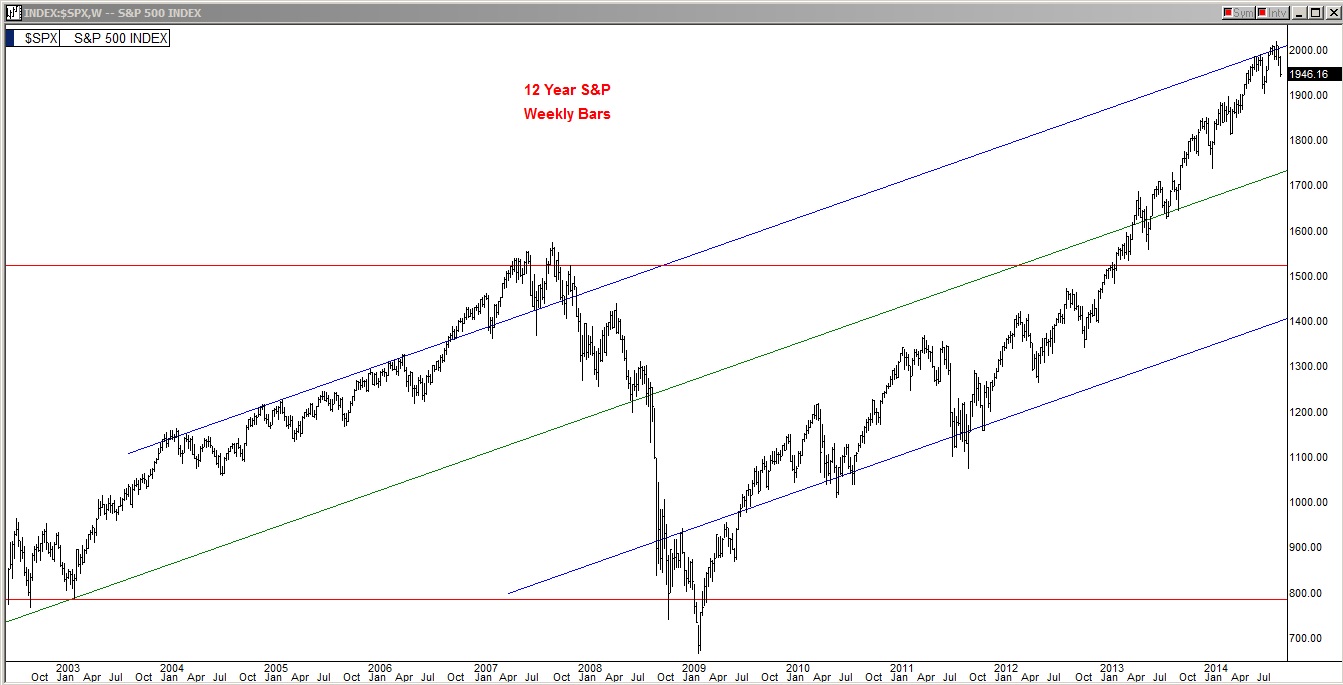
The second chart is the 12-year chart of the S&P using weekly bars where we get a better view of the topping action at the upper blue channel line.

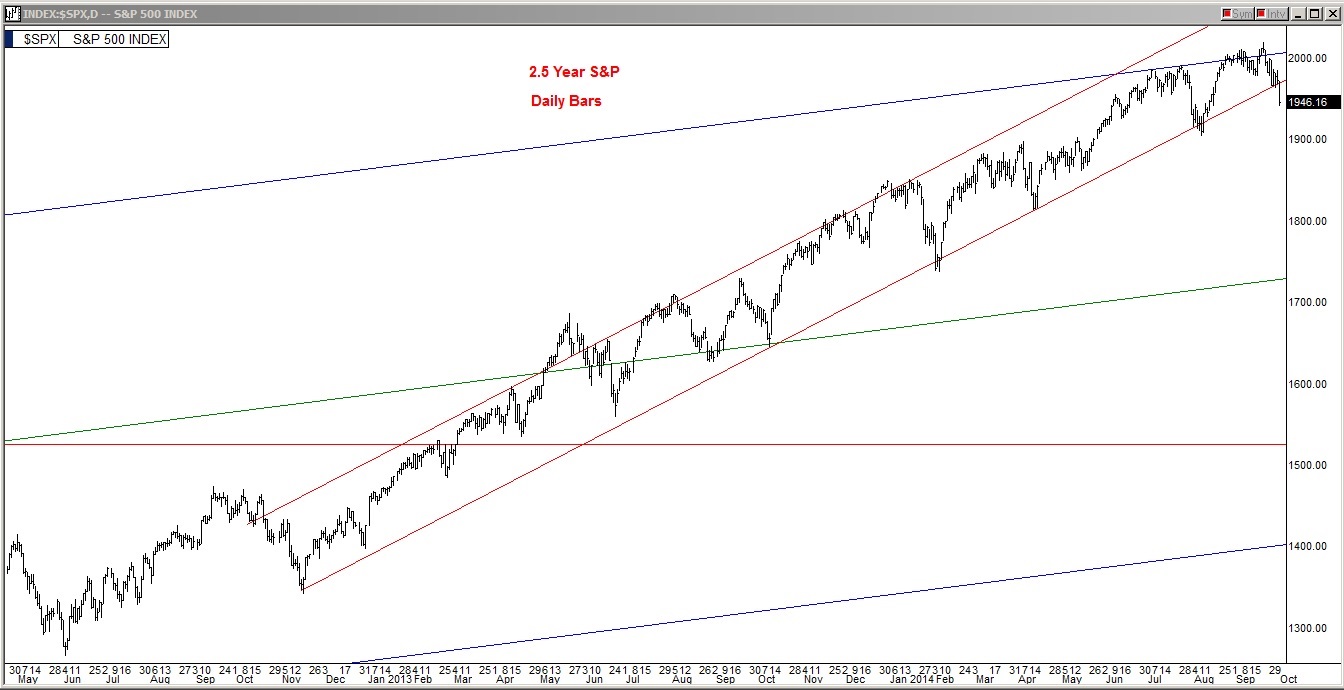
The third chart is the 2.5 year chart of the S&P where we see today's selling frenzy was partly driven because we lost the lower line of the channel that Bernanke started to ease the pain of the coming QE withdrawal.
S&P - 2.5 Years

These three charts show that the big picture is at least questionable now.
VIX
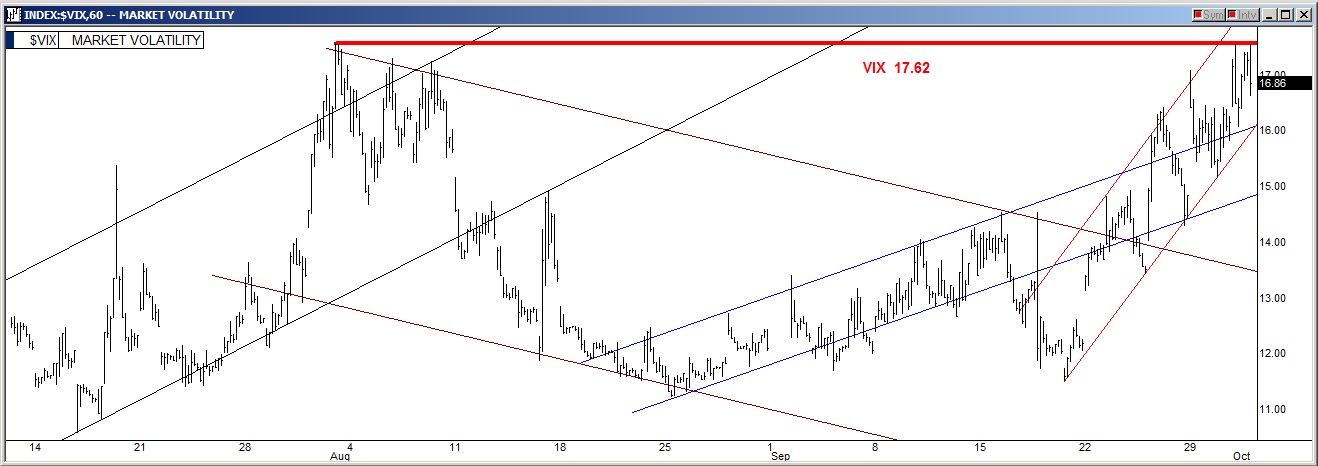
For the next few days, however, the VIX chart will become top priority. The short term VIX chart (the last chart) will be everyone's focus to determine if the August 1st VIX peak at 17.62 holds and gives the stock market some bounce back or if we break through it and the real selling begins.

Looking at this VIX chart we can see that we have tested this ceiling of 17.62 (shown with the heavy red line) twice this week and it has held so far. Considering that double test, the odds of a market bounce Thursday have substantially increased. If the market does bounce, it's not too late to undo some of the damage done to Tuesday night's charts during Wednesday's selling.

3rd party Ad. Not an offer or recommendation by Investing.com. See disclosure here or remove ads .

Latest comments

Risk Disclosure: Trading in financial instruments and/or cryptocurrencies involves high risks including the risk of losing some, or all, of your investment amount, and may not be suitable for all investors. Prices of cryptocurrencies are extremely volatile and may be affected by external factors such as financial, regulatory or political events. Trading on margin increases the financial risks.
Before deciding to trade in financial instrument or cryptocurrencies you should be fully informed of the risks and costs associated with trading the financial markets, carefully consider your investment objectives, level of experience, and risk appetite, and seek professional advice where needed.
Fusion Media would like to remind you that the data contained in this website is not necessarily real-time nor accurate. The data and prices on the website are not necessarily provided by any market or exchange, but may be provided by market makers, and so prices may not be accurate and may differ from the actual price at any given market, meaning prices are indicative and not appropriate for trading purposes. Fusion Media and any provider of the data contained in this website will not accept liability for any loss or damage as a result of your trading, or your reliance on the information contained within this website.
It is prohibited to use, store, reproduce, display, modify, transmit or distribute the data contained in this website without the explicit prior written permission of Fusion Media and/or the data provider. All intellectual property rights are reserved by the providers and/or the exchange providing the data contained in this website.
Fusion Media may be compensated by the advertisers that appear on the website, based on your interaction with the advertisements or advertisers.
© 2007-2024 - Fusion Media Limited. All Rights Reserved.