Upcoming US Events for Today:
- Motor Vehicle Sales for March will be released throughout the day. The market expects Total Vehicle Sales to increase to 15.8M versus 15.3M previous.
- PMI Manufacturing Index for March will be released at 9:45am.The market expects 56.8 versus 57.1 previous.
- ISM Manufacturing Index for March will be released at 10:00am. The market expects 54.0 versus 53.2 previous.
- Construction Spending for February will be released at 10:00am. The market expects a month-over-month increase of 0.1%, consistent with the previous report.
Upcoming International Events for Today:
- German Unemployment Change for March will be released at 3:55am EST. The market expects a decline of 10K versus a decline of 14K previous. The Unemployment Rate is expected to remain unchanged at 6.8%.
- German Manufacturing PMI for March will be released at 3:55am EST. The market expects 53.8, consistent with the previous report.
- Euro-Zone Manufacturing PMI for March will be released at 4:00am EST. The market expects 53, consistent with the previous report.
- Great Britain Manufacturing PMI for March will be released at 4:30am EST. The market expects 56.5 versus 56.9 previous.
- Euro-Zone Unemployment Rate for February will be released at 5:00am EST. The market expects no change at 12.0%.
- RBC Canadian Manufacturing PMI for March will be released at 9:30am EST.
The Market
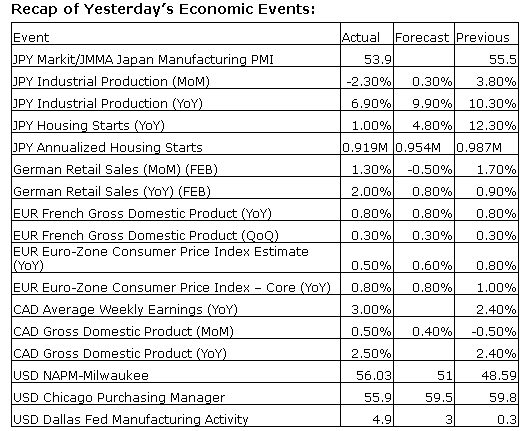
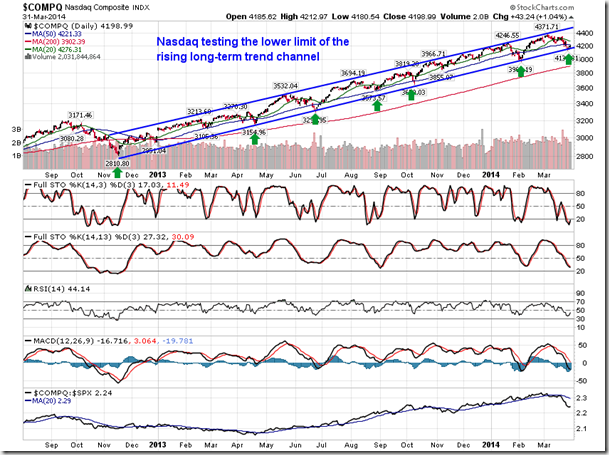
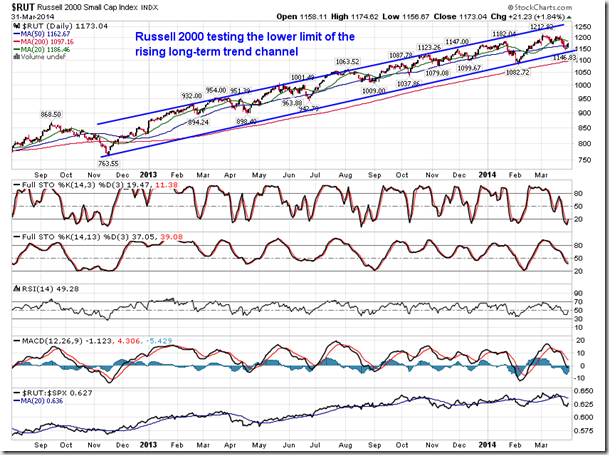
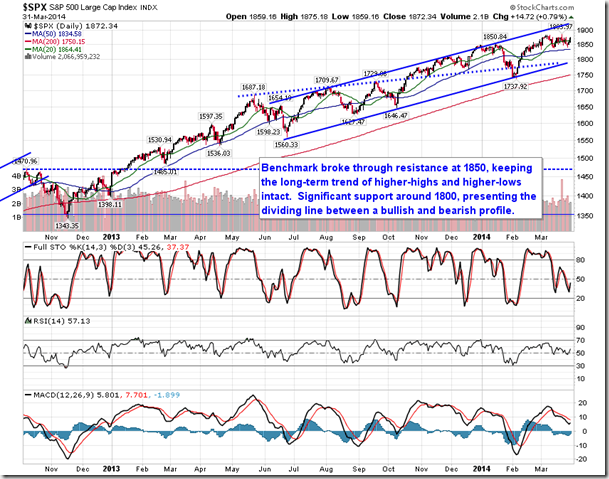
Stocks rebounded on Monday as Janet Yellen provided new assurances on the Fed’s commitment to maintain accommodative monetary policies. Speculation had arisen since her speech at the last FOMC news conference that a rate increase would come sooner than later, but, in her speech on Monday, the Fed Chair expressed concern that the economy and job market were far from normal health, warranting support from the central bank for some time to come. Investors immediately bid stocks higher, particularly within the beaten down Health Care and Biotech areas. The Nasdaq Composite and the Russell 2000 Index both bounced firmly from the lower limit of their long-term rising trend channels, while the S&P 500 tested a point of short-term resistance at 1875, hovering around the highs of the year after making very little progress in the first quarter.
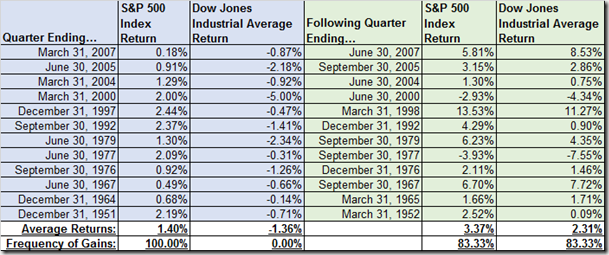
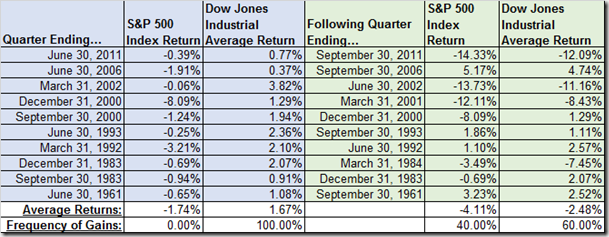
For the quarter, the S&P 500 Index closed higher by 1.30%, the Nasdaq closed higher by 0.54%, and the Dow Jones Industrial Average negatively diverged from the rest, closing lower by 0.72%. Since 1950, 12 other occurrences of the S&P 500 Index closing higher on the quarter and the Dow Jones Industrial Average closing lower have been recorded. The last occurrence was realized during the first quarter of 2007 when the S&P 500 posted a quarterly gain of 0.18% and the Dow posted a loss of 0.87%; the Dow Jones Industrial Average accelerated during the quarter to follow, gaining 8.53%, surpassing the S&P 500 return of 5.81%, thereby closing the gap that was created during Q1 of that year. The 12 similar quarterly disparities between the two benchmarks have averaged gains for each during the quarter that followed. Gains for the S&P 500 Index following similar instances have averaged 3.37% for the quarter, while gains for the Dow Jones Industrial Average have averaged 2.31%. However, when the situation is reversed and the S&P 500 Index ended with a quarterly loss while the Dow Jones Industrial Average ended with a quarterly gain, the resulting average returns over the quarter to follow are not as favourable. Under this scenario, the S&P 500 Index averaged a decline of 4.11% during the quarter to follow, while the Dow Jones Industrial Average declined by an average of 2.48%. As we’ve been discussing over recent days, riskier assets (eg. momentum stocks) will typically act as a leading indicator for the broad market. The large-cap S&P 500 fits the characteristic of being the riskier asset over the blue-chip Dow Jones Industrial Average, therefore the positive divergence this quarter provides a favourable indication of what to expect for the quarter ahead. Since 1950, the average quarterly gain for the S&P 500 during the second quarter is 1.68%, while the Dow has averaged a gain of 1.64%.
S&P 500 posts quarterly gain while Dow Jones Industrial Average posts quarterly loss:
S&P 500 posts quarterly loss while Dow Jones Industrial Average posts quarterly gain:
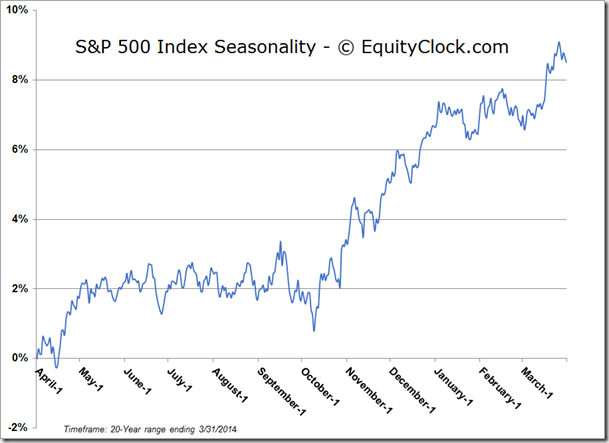
With April now upon us, it is worthwhile to take a look at the averages for this fourth month of the year. Over the past 20 years, April has been the most profitable month of the year for the S&P 500 Index. The large-cap index has gained 2.2%, on average, with a gain frequency of 75%. April also marks the last month of the favourable six month period for the broad equity market. Mid-term election years typically bring an end to the favourable six month period for equity markets sooner than typical. During this second year of the Presidential Election Cycle, the average peak for the S&P 500 has occurred by mid-April, on average.
S&P 500 Returns over the past 20 years:

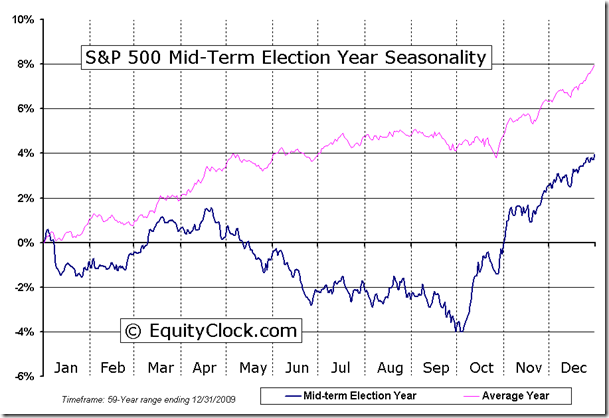
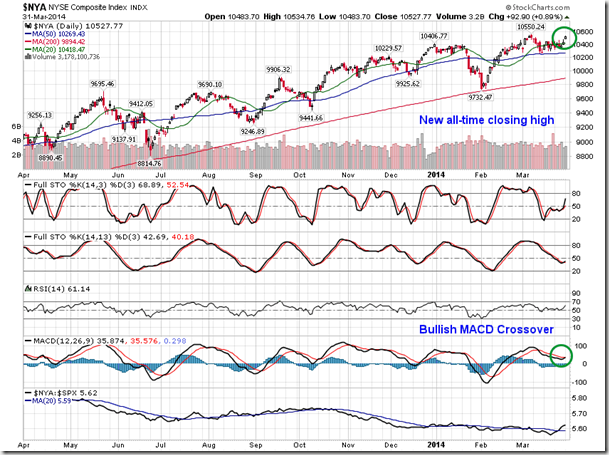
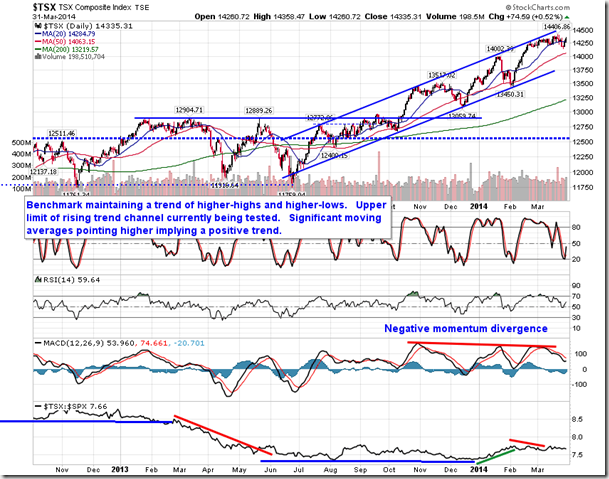
Despite all of these statistics, from the quarterly tendencies to the monthly tendencies to the mid-term election year tendencies, the technicals are required to confirm the resulting trend. Although momentum has certainly stalled since the year began and warning signals have been provided (eg. recent weakness in momentum stocks), the trend of the broad equity market remains positive. The NYSE Composite charted a new all-time closing high on Monday, keeping the trend of higher-highs and higher-lows alive. As mentioned above, the Nasdaq Composite and Russell 2000 are maintaining long-term rising trend channels. Major moving averages, such as the 50 and 200-day, on many of the benchmarks continue to point higher, implying a positive trend. Until the technicals confirm otherwise, a bullish bias is warranted. The chart of the average performance during mid-term election years remains a useful blueprint for this year, perhaps moreso than the quarterly and monthly averages given the fundamental influence that affects one over the others; if the chart holds true, technical sell signals should be sought over the weeks ahead.
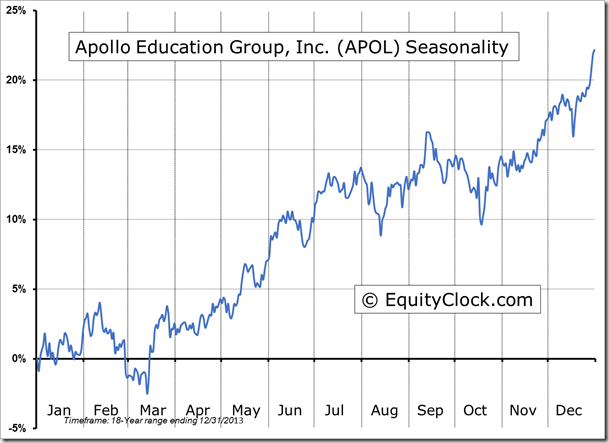
Seasonal charts of companies reporting earnings today:
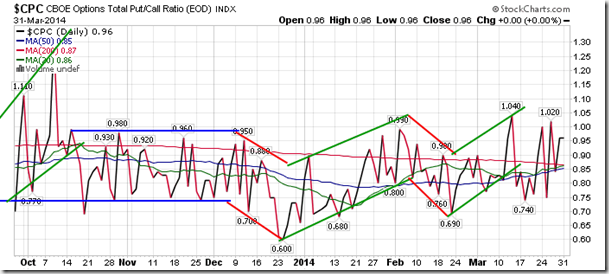
Sentiment on Monday, as gauged by the put-call ratio, ended close to neutral at 0.96.
S&P 500 Index
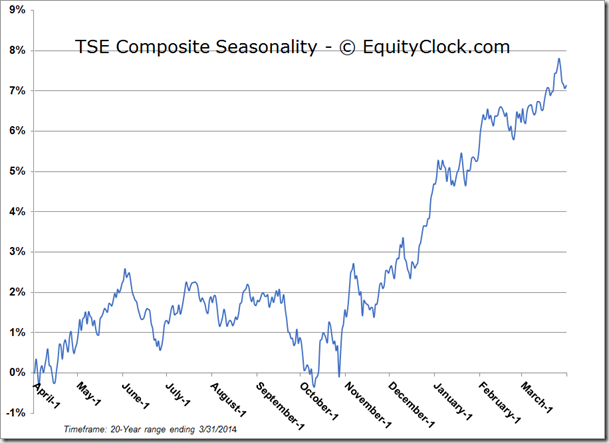
TSE Composite
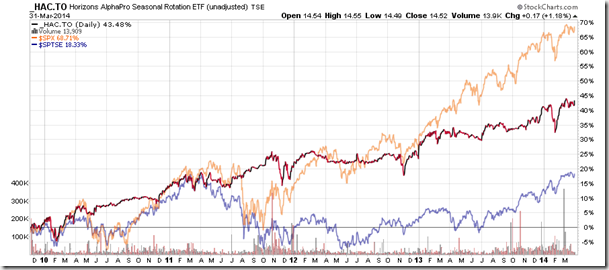
Horizons Seasonal Rotation ETF (TSX:HAC)
- Closing Market Value: $14.52 (up 1.18%)
- Closing NAV/Unit: $14.51 (up 0.79%)
Performance*
| 2014 Year-to-Date | Since Inception (Nov 19, 2009) | |
| HAC.TO | 1.47% | 45.1% |
