Get 40% Off
👀 👁 🧿 All eyes on Biogen, up +4,56% after posting earnings. Our AI picked it in March 2024.
Which stocks will surge next?
Unlock AI-picked Stocks

S&P 500: Did Fed Spawn Rally?

Published 12/19/2014, 10:24 AM
Updated 05/14/2017, 06:45 AM

Let’s close out the week with a look at the S&P 500. Following the Federal Reserve Open Market Committee statement Wednesday, the S&P 500 took off. Traders and pundits attributed the move to the Fed changing their language in the statement. Something about changing ‘Considerable time’ to ‘patient’ I think.

My read was that they just reiterated what they have been saying. They are not raising interest rates now and are not in a hurry to do so. So if they did not change their view, did the Fed really instigate a rally? Or did paranoid traders and investors that have continually been unable to stay invested for any lengthy period of time since 2009 wake up upon reading the statement and realize yet again they sold for no good reason? I would tend to go with the latter if I was a fan of creating a narrative.

The S&P 500

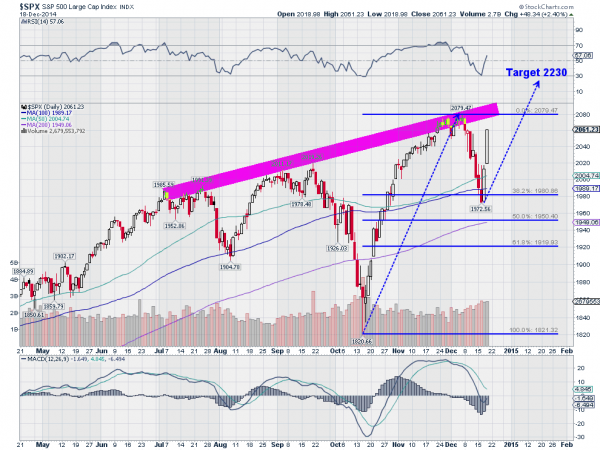
But there are plenty of other reasons in the price chart that could give a clue or reason for a bounce when and where it happened. First the S&P 500 had retraced 38.2% of the move higher since the October low. It also had moved to a short term oversold position on the RSI. Finally it had moved below the 100-day SMA. Theses alone are not reasons to jump in and buy. Retracements can go lower, momentum can become more oversold and there is always another SMA lower. But they give a reason to take notice, and when the turn does come to believe in it.

3rd party Ad. Not an offer or recommendation by Investing.com. See disclosure here or remove ads .

Now that the S&P 500 has had an explosive two day 4.25% rally what does the chart say is next? More upward price action. The RSI is rising and the MACD turning back up, giving a positive check-mark from the momentum indicators. The candlestick on Thursday, a Marubozu, is a very bullish candle that looks for more upside. And the Measured Move higher would target at run up to 2230. There looks to be a potential resistance zone between 2080 and 2100 in the short run if the trend of the last 6 months continues. But a break of that trend would also trigger an irregular Inverse Head and Shoulders pattern that would have a price objective of at least 2320.

Things are looking bright for the S&P 500 now. Funny how just two days can change everything.

Original Post

Latest comments

pointless drivel
Risk Disclosure: Trading in financial instruments and/or cryptocurrencies involves high risks including the risk of losing some, or all, of your investment amount, and may not be suitable for all investors. Prices of cryptocurrencies are extremely volatile and may be affected by external factors such as financial, regulatory or political events. Trading on margin increases the financial risks.
Before deciding to trade in financial instrument or cryptocurrencies you should be fully informed of the risks and costs associated with trading the financial markets, carefully consider your investment objectives, level of experience, and risk appetite, and seek professional advice where needed.
Fusion Media would like to remind you that the data contained in this website is not necessarily real-time nor accurate. The data and prices on the website are not necessarily provided by any market or exchange, but may be provided by market makers, and so prices may not be accurate and may differ from the actual price at any given market, meaning prices are indicative and not appropriate for trading purposes. Fusion Media and any provider of the data contained in this website will not accept liability for any loss or damage as a result of your trading, or your reliance on the information contained within this website.
It is prohibited to use, store, reproduce, display, modify, transmit or distribute the data contained in this website without the explicit prior written permission of Fusion Media and/or the data provider. All intellectual property rights are reserved by the providers and/or the exchange providing the data contained in this website.
Fusion Media may be compensated by the advertisers that appear on the website, based on your interaction with the advertisements or advertisers.
© 2007-2024 - Fusion Media Limited. All Rights Reserved.