
T2108 Status: 59.7%
T2107 Status: 50.9%
VIX Status: 14.9
General (Short-term) Trading Call: Aggressive bears can try shorts with VERY tight stops (I do not recommend any except in very special cases – see below); otherwise hold
Active T2108 periods: Day #12 over 20%, Day #10 over 30%, Day #7 over 40%, Day #5 over 50%, Day #1 under 60% (ending 1 day over 60%), Day #82 under 70%
Commentary
It was a close call yesterday. The S&P 500 (SPDR S&P 500 (ARCA:SPY)) almost confirmed another topping pattern with Monday’s evening star pattern…almost reminiscent of the evening star in mid-September. This time, however, the sellers could not quite close out the deal as the S&P 500 made a courageous bounce off the lows of the day.

Sellers trying hard to force the issue on a potential double-top
For those keeping score, a MAJOR difference from the September 19th top is Alibaba Group Holdings (NYSE:BABA) which IPOd on that fateful day. Fast-forward and BABA has delivered its first earnings report, swooned below $100 a bit just to give the doubters some hope, and then soared to fresh all-time highs and a respectable 4.2% post-earnings gain. This is a classic trend continuation move that definitely confirms the breakout on Monday from last week’s brief consolidation.

Alibaba soars to fresh all-time highs after delivering its first earnings report as a publicly traded company
Still, BABA was an exception on the day. T2108 closed down at 59.7%. Given it has stalled right where it topped out in early September, I have to sit up straight and stay on alert again.
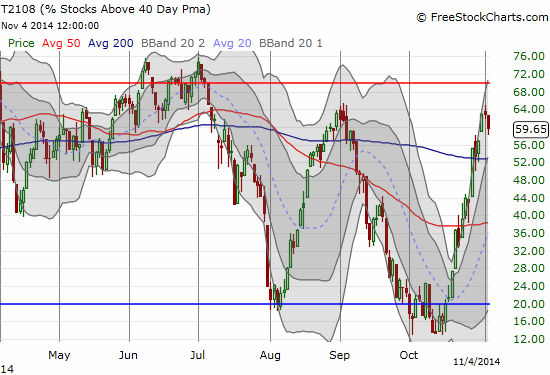
A fresh warning sign from T2108?
Adding to my wariness is Caterpillar, Inc. (Caterpillar Inc (NYSE:CAT)). Despite my doubts, the stock actually managed to fail at the natural resistance of the converged 50 and 200DMAs. This confirms CAT as the PERFECT hedge here.
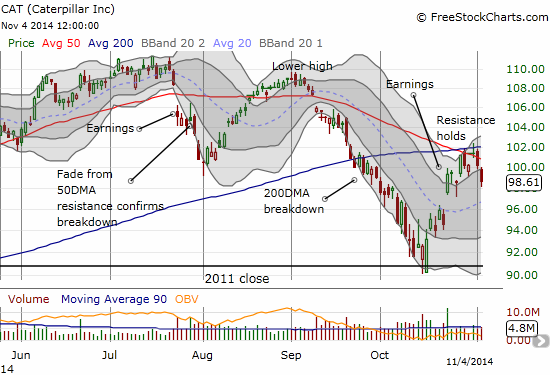
Caterpillar’s post-earnings rally comes to an abrupt end
I stuck to the current plan and aggressively bought the dip of the day with call options on ProShares Ultra S&P500 (ARCA:SSO). The late bounce thankfully put me in the green at the close. As usual, I plan to sell these into the next pop while continuing to hold my SSO shares.
Another post-earnings stock that has my attention is Priceline Group (NASDAQ:PCLN). It managed to fail perfectly at 200DMA resistance pre-earnings.
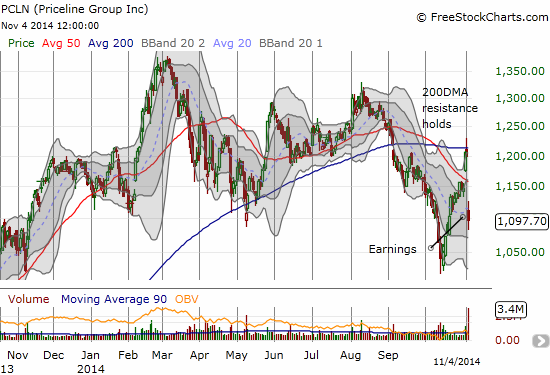
PCLN breaks down from 200DMA resistance
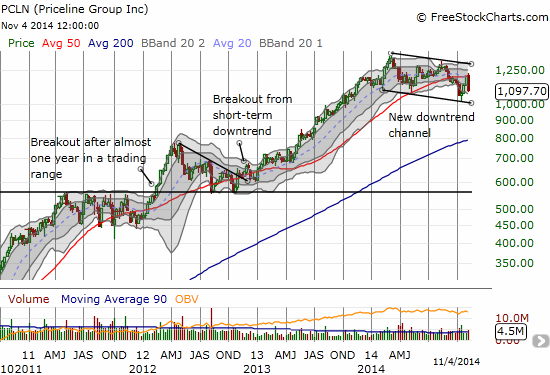
Over the longer-term, PCLN has made very distinct technical moves delivering lasting breakouts
The second PCLN chart shows that the stock has been “well-behaved” on a weekly basis. I now have the stock on active watch for playing bounces within the current channel. Given the overall bullish stance of the market, I am inclined to play the stock for a bounce off the bottom of the channel. However, this is more risky than usual for PCLN since it is now under-performing the S&P 500. Note that the overall lesson from the chart is that if/when PCLN finally breaks out of this channel, upside or downside, the move should be lasting.
I like to say it is ALWAYS hard to get bearish when Apple (NASDAQ:AAPL) is trading well. Since gapping up post-earnings, AAPL has been trading and trending in a near straight line neatly nestled between the two Bollinger® Bands (BB). I was positioned a little too bearishly for the pre-earnings trade, but I have begun making up for that by following this subsequent uptrend. I have also updated the Apple Trading Model (ATM) – click the link to download the latest regression (decision) trees.
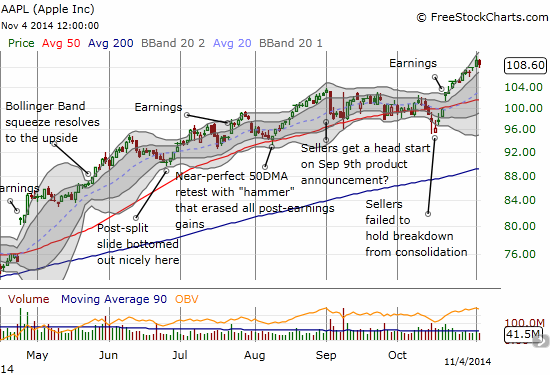
Apple has been on a mission of fresh all-time highs since its post-earnings breakout
Finally, I could not help noticing that oil has reached an important level in the form of PowerShares DB Oil ETF (NYSE:DBO). DBO has reached support that has held since the recession officially ended in 2009. I am normally inclined to play retests of such support. However in this case I am content to wait to see DBO actually bounce off this support. Moreover, it is hard to imagine DBO getting much upside momentum as long as the US dollar is still trading and trending higher.
Whenever I conclude that the rally is finally ending, DBO might be one of the first plays I attempt to make against the US dollar.
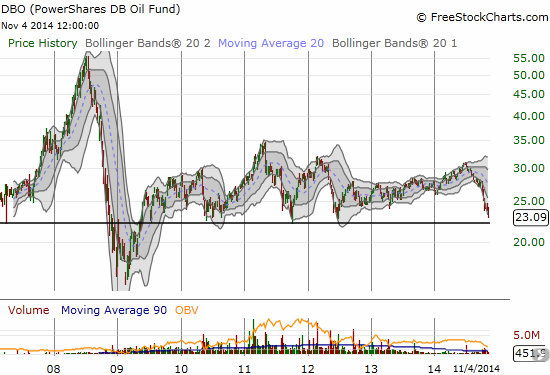
DBO is reaching critical support
Note how volume has trailed off significantly in 2014. Even the current slide has not generated nearly as much volume as DBO enjoyed from 2010 to 2013. It is very possible traders have moved on to other oil-related plays. If volume picks up to the downside or the upside, I will consider it a major confirmation of whatever move DBO is experiencing at the time.
Daily T2108 vs the S&P 500
")
Black line: T2108 (measured on the right); Green line: S&P 500 (for comparative purposes)
Red line: T2108 Overbought (70%); Blue line: T2108 Oversold (20%)
Weekly T2108

Be careful out there!
Disclosure: long SSO sares and call options, long CAT put options