US stocks rebounded yesterday after a significant 2 day drop last week, relieving bearish pressure and averting a potential meltdown which was certainly in the books should last week sell-off shift global sentiment from a long-term bullish into a bearish one.
The reason for the bullish cheers? We have stronger than expected US Retail Sales figures which grew 1.1% vs 0.9% expected - the strongest gain in 18 months. On top of that, previous month's figure was revised higher to 0.7% as well, suggesting that US economy is actually going on strong. Given that stock prices are driven by fundamental, it is reasonable to expect stronger bullish follow-through as there may be a shift in short-term sentiment due to this latest development.
Hourly Chart

That would have been the perfect bullish reversal narrative, but unfortunately things are rarely so straight forward and this time round is no exception.
Firstly, we need to realize that despite the strongest retail print in 18 months, retail stocks were not the biggest gainers yesterday, which suggest that the gain in stocks are not really due to the Retail Sales number but may simply be a technical rebound aka "Dead Cat Bounce". Interestingly, both 3 major US stock indexes gained around the same - S&P 500 +0.82%, Nasdaq 100 +0.81% while the less diversified DJI was stronger at +0.91%. With such similar gains, it is difficult to shake off the suspicion of the technical rebound charge.
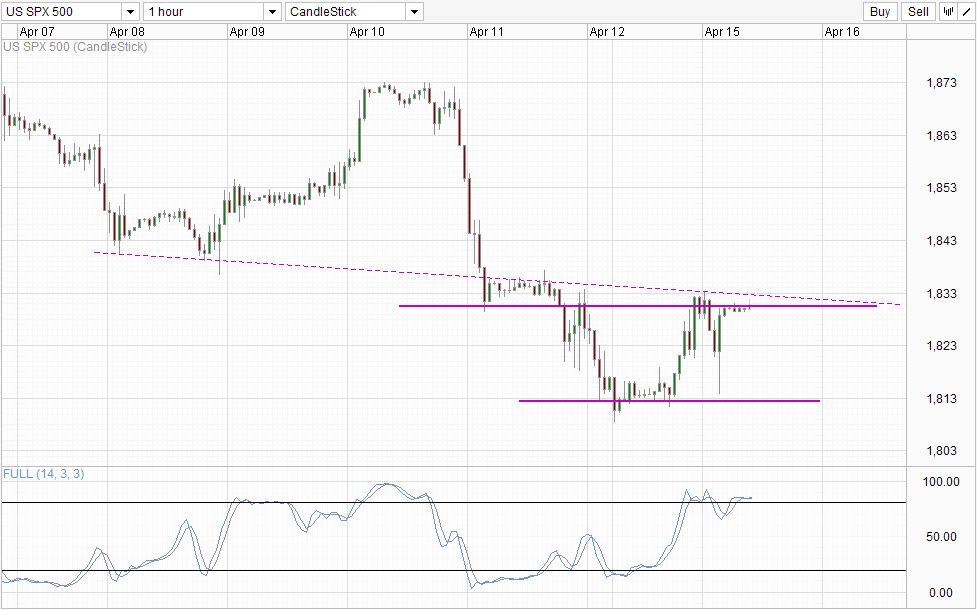
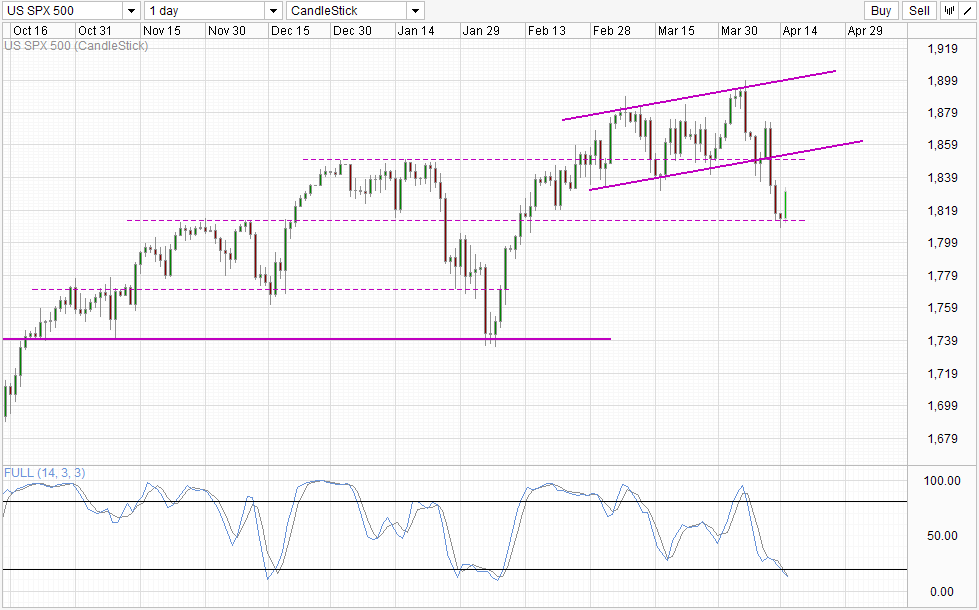
Case in point, it seems that bearish sentiment is alive and well. S&P 500 rebounded off the 1,812.5 support (more visible on Daily Chart below) and pushed up higher but saw significant resistance at 1,830, resulting in a strong bearish reaction bringing us close to 1,812.5 once more before last ditch bullish effort allowing us to close near the 1,830 level. This is a strong testament to strong bearish pressure and adds to the suspicion that yesterday's rally is simply corrective in nature (e.g. temporary pullback) rather than a genuine bullish move.
From a technical perspective, we are currently facing resistance from both 1,830 and the descending trendline that was previous support now turned resistance. Stochastic indicator has also plateaued within the Overbought region, strongly favoring a bearish move moving forward. Hence, if we start to see prices falling below the Asian lows of 1,829, the likelihood of a move back towards 1,812.5 is high and we may even see a break of the support level as this would imply that the broad bearish momentum is back again.
Daily Chart

Daily Chart is less bearish though, as a rebound off 1,812.5 opens up a potential move towards 1,850. Couple this with Stochastic readings which are heavily Oversold it is not difficult to imagine prices having the potential to hit 1,850 on a mere corrective move. However, right now there isn't any evidence that this is happening. The bullish reversal Morning Star pattern which is forming now is weak as the right bullish candle is not able to overlap the left bearish candle, as such the validity of this pattern needs to be discounted.
From a long-term fundamental perspective, it is clear that stock prices are still too expensive, and everybody is waiting for the 10-20% correction that has yet to materialize. Economic growth remains below previous expectations, and that is yet another strike against continued bullish move. However, L/T sentiment has been bullish so much so that traders are still buying stocks at such record levels using the highest leverage/margin levels on record. Hence, should sentiment has been confirmed to have reversed, we could see bears coming back with a vengeance, giving us the much awaited L/T bearish pullback.
