Get 40% Off
👀 👁 🧿 All eyes on Biogen, up +4,56% after posting earnings. Our AI picked it in March 2024.
Which stocks will surge next?
Unlock AI-picked Stocks

S&P 500 Starts Slipping

Published 09/16/2014, 02:40 AM
Updated 07/09/2023, 06:31 AM

The S&P 500 is one of the world’s most actively traded futures contracts, and lately has been pushing the 2000 mark quite strongly.

For a little while it was quite an attractive trade for many traders looking to scalp the band that had formed in the market. However, over the past few days since market openings we have seen the band breakdown and the scalpers start to drift away.
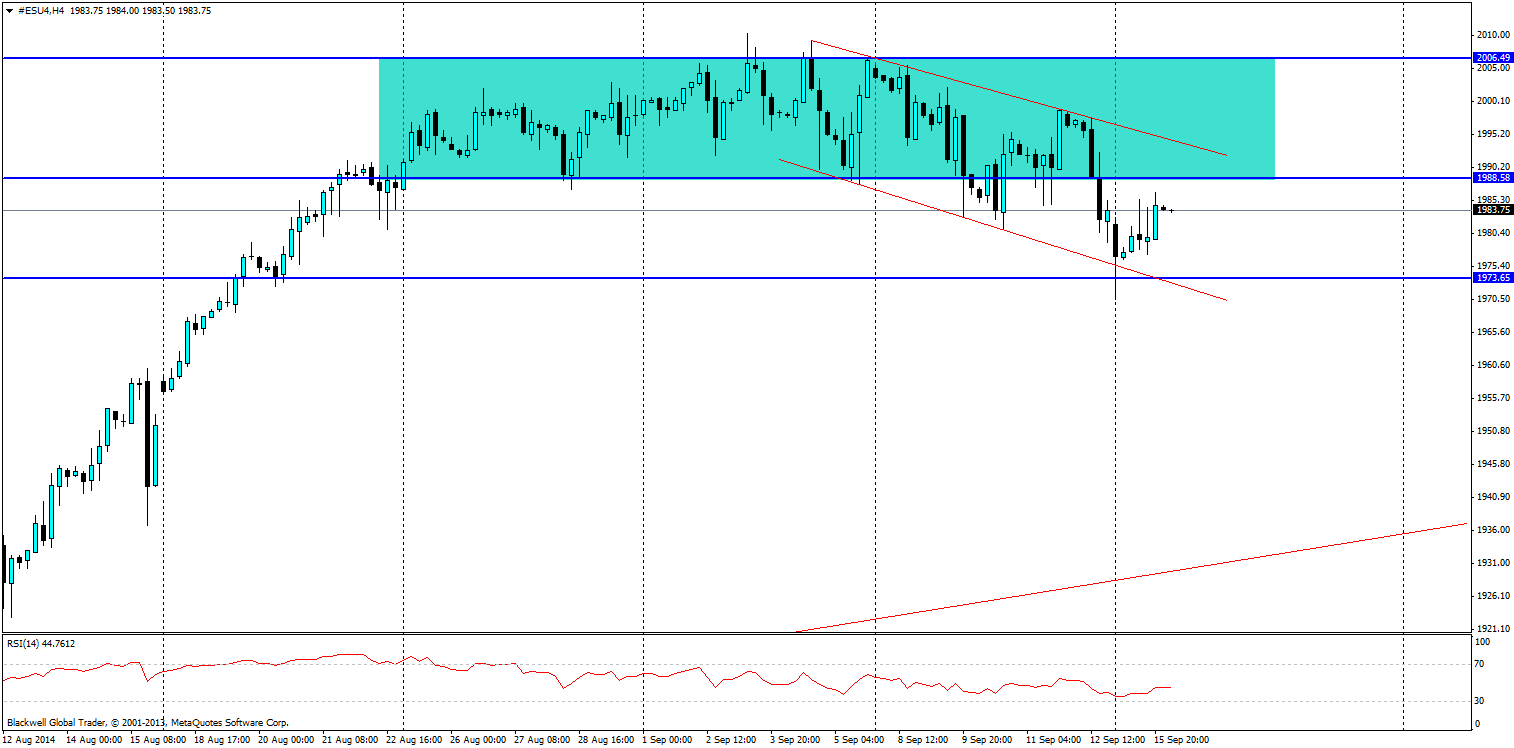
S&P 500 Hourly Chart

Previously we had a period of pressure and constant liquidity, and this remained quite strong in the markets for some time. Scalping was heavy during this period as traders look to play of strong support and resistance levels as the market had little to no direction.

This band of liquidity has since given way to a bearish channel which has started to form in the short to medium term.

This bearish channel at present is still quite wide, and markets have so far seen some aggressive pushes on it, to try and see if the bears are ready for a solid swipe. At present it looks likely we will see further pushes lower for the S&P 500, with strong support likely to be found at 1973.65.
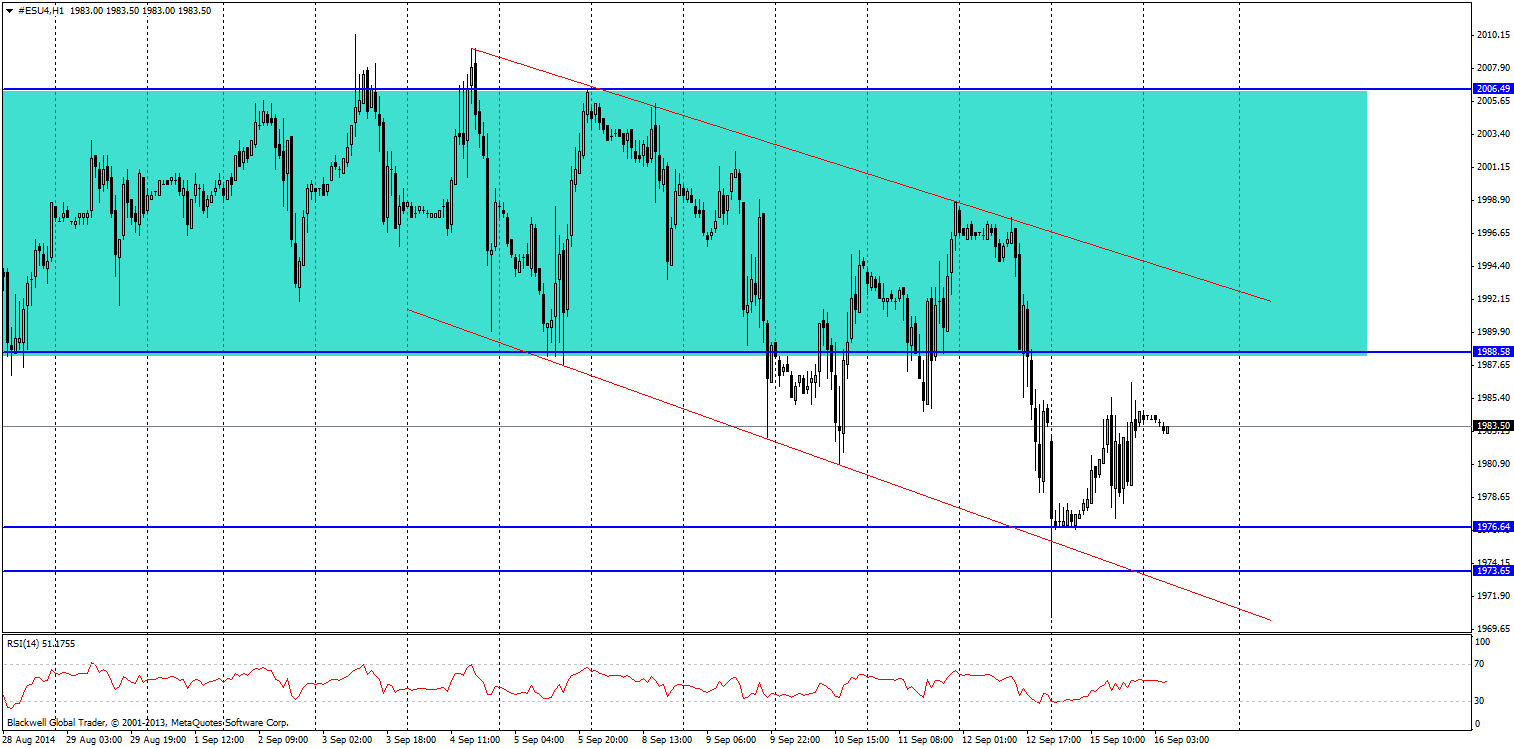
S&P500 Hour Chart

The hourly charts also shows very strong support at 1976.64 and short term traders should target this level for profit taking as a well as the possibility of a pullback of it. In regards to resistance it can be found at 1983.75 and looks very strong in the current market climate.

With the US economy barrelling towards interest rate rises we may be on the cusp of seeing a minor correction in the S&P 500. With all of this in mind, it’s likely we will see further falls and the trend is your friend in this case. Just be careful of key resistance and support levels as the S&P 500 has a tendency to bounce around between them.

3rd party Ad. Not an offer or recommendation by Investing.com. See disclosure here or remove ads .

Latest comments

Risk Disclosure: Trading in financial instruments and/or cryptocurrencies involves high risks including the risk of losing some, or all, of your investment amount, and may not be suitable for all investors. Prices of cryptocurrencies are extremely volatile and may be affected by external factors such as financial, regulatory or political events. Trading on margin increases the financial risks.
Before deciding to trade in financial instrument or cryptocurrencies you should be fully informed of the risks and costs associated with trading the financial markets, carefully consider your investment objectives, level of experience, and risk appetite, and seek professional advice where needed.
Fusion Media would like to remind you that the data contained in this website is not necessarily real-time nor accurate. The data and prices on the website are not necessarily provided by any market or exchange, but may be provided by market makers, and so prices may not be accurate and may differ from the actual price at any given market, meaning prices are indicative and not appropriate for trading purposes. Fusion Media and any provider of the data contained in this website will not accept liability for any loss or damage as a result of your trading, or your reliance on the information contained within this website.
It is prohibited to use, store, reproduce, display, modify, transmit or distribute the data contained in this website without the explicit prior written permission of Fusion Media and/or the data provider. All intellectual property rights are reserved by the providers and/or the exchange providing the data contained in this website.
Fusion Media may be compensated by the advertisers that appear on the website, based on your interaction with the advertisements or advertisers.
© 2007-2024 - Fusion Media Limited. All Rights Reserved.