Get 40% Off
👀 👁 🧿 All eyes on Biogen, up +4,56% after posting earnings. Our AI picked it in March 2024.
Which stocks will surge next?
Unlock AI-picked Stocks

S&P 500 Snapshot: Worst Week In 2 1/2 years

Published 12/14/2014, 03:29 AM
Updated 07/09/2023, 06:31 AM

S&P 500 opened lower and sold off in a couple of waves to close at its intraday low at -1.62%. Anxieties in Europe set the tone, with the DJ Euro Stoxx 50 plunging 2.91%. The market has also been disconcerted by the ongoing decline in West Texas Crude Oil, which is down 3.67% as I type this. Today's big jump in the Michigan Consumer Sentiment made was irrelevant to today's trade. The S&P 500 is down 3.15% for the week (last Friday being a record close). That's the worst weekly performance for the index since the -4.30% loss in mid-May 2012.

The yield on the U.S. 10-Year Note ended the day at 2.18%. That's 21 bps off last Friday's close.

Here is a 15-minute chart of the week.
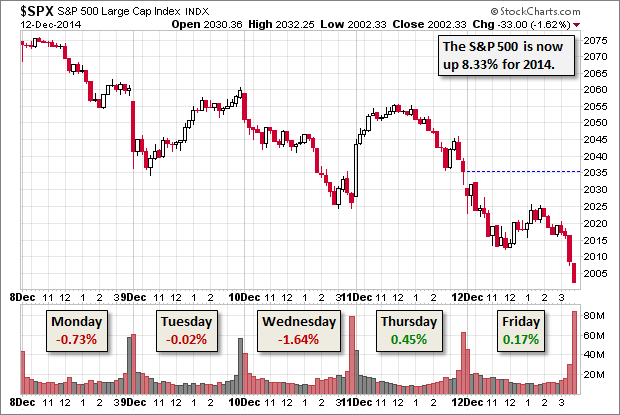
S&P 500 Large Cap Index

Here is a weekly chart of the SPY ETF, which gives a better sense of investor participation. Today's close puts it right at its 10-week moving average on above-average weekly volume.
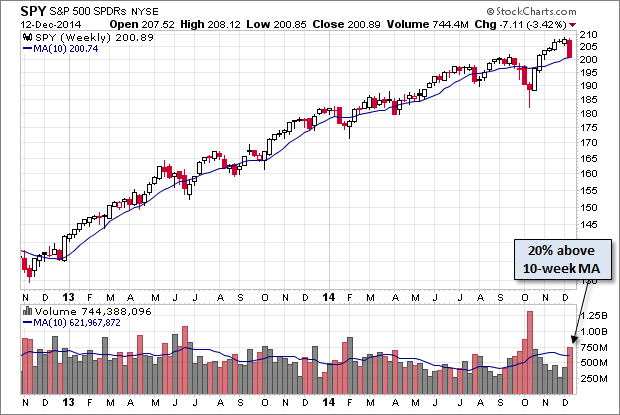
S&P 500 SPDRs Weekly Chart

A Perspective on Drawdowns

We're now five days off the record close in the S&P 500. Here's a snapshot of selloffs since the 2009 trough.
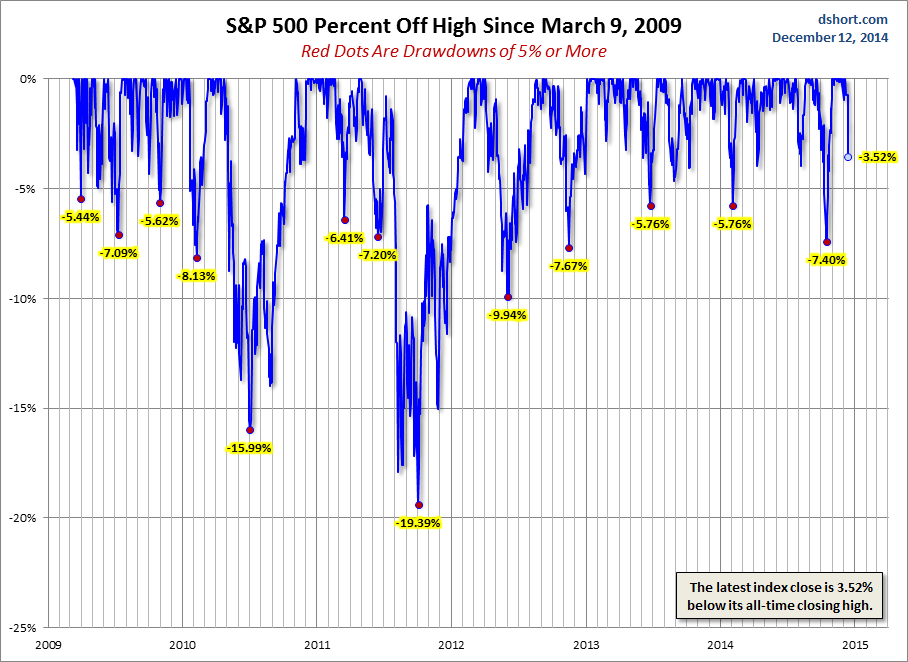
S&P 500 Chart

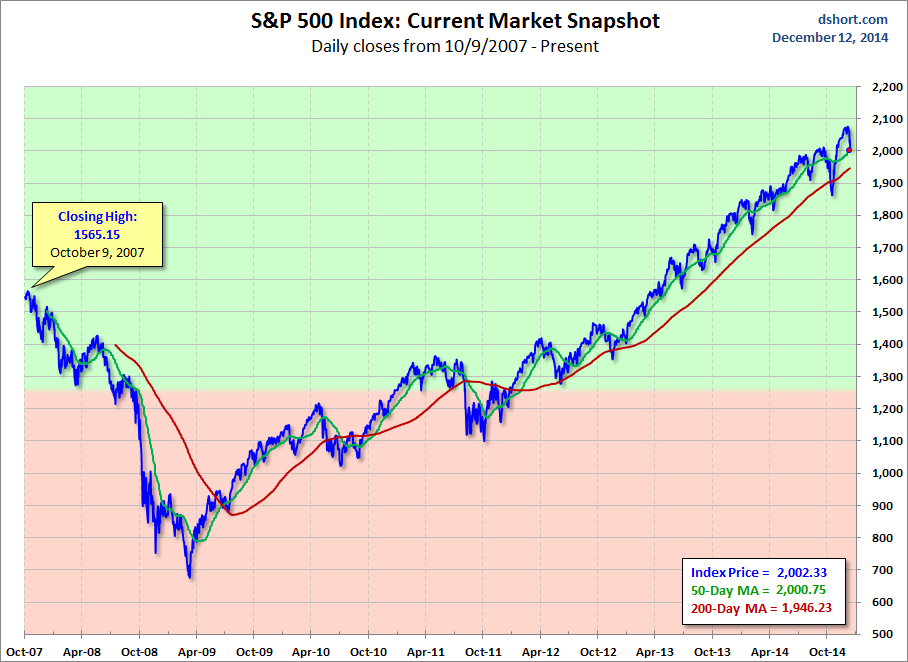
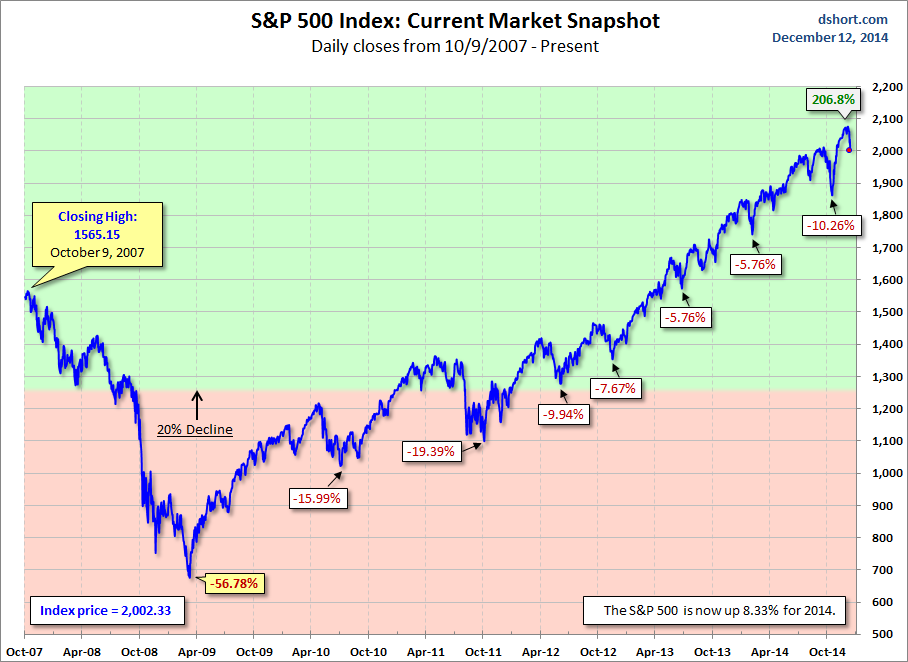
For a longer-term perspective, here is a pair of charts based on daily closes starting with the all-time high prior to the Great Recession.
S&P 500 Chart

S&P 500 Chart

Latest comments

Risk Disclosure: Trading in financial instruments and/or cryptocurrencies involves high risks including the risk of losing some, or all, of your investment amount, and may not be suitable for all investors. Prices of cryptocurrencies are extremely volatile and may be affected by external factors such as financial, regulatory or political events. Trading on margin increases the financial risks.
Before deciding to trade in financial instrument or cryptocurrencies you should be fully informed of the risks and costs associated with trading the financial markets, carefully consider your investment objectives, level of experience, and risk appetite, and seek professional advice where needed.
Fusion Media would like to remind you that the data contained in this website is not necessarily real-time nor accurate. The data and prices on the website are not necessarily provided by any market or exchange, but may be provided by market makers, and so prices may not be accurate and may differ from the actual price at any given market, meaning prices are indicative and not appropriate for trading purposes. Fusion Media and any provider of the data contained in this website will not accept liability for any loss or damage as a result of your trading, or your reliance on the information contained within this website.
It is prohibited to use, store, reproduce, display, modify, transmit or distribute the data contained in this website without the explicit prior written permission of Fusion Media and/or the data provider. All intellectual property rights are reserved by the providers and/or the exchange providing the data contained in this website.
Fusion Media may be compensated by the advertisers that appear on the website, based on your interaction with the advertisements or advertisers.
© 2007-2024 - Fusion Media Limited. All Rights Reserved.