It’s only May 20, and not only is volatility up, but so are the volumes. On Wednesday, the CME Group’s (CME) S&P 500 futures (ESM16:CME) total volume was 1.86 million contracts. Yesterday at 1:00 CT total volume in the emini S&P was 1.57 million contracts traded. In most cases the volumes are always higher when the index markets sell off.
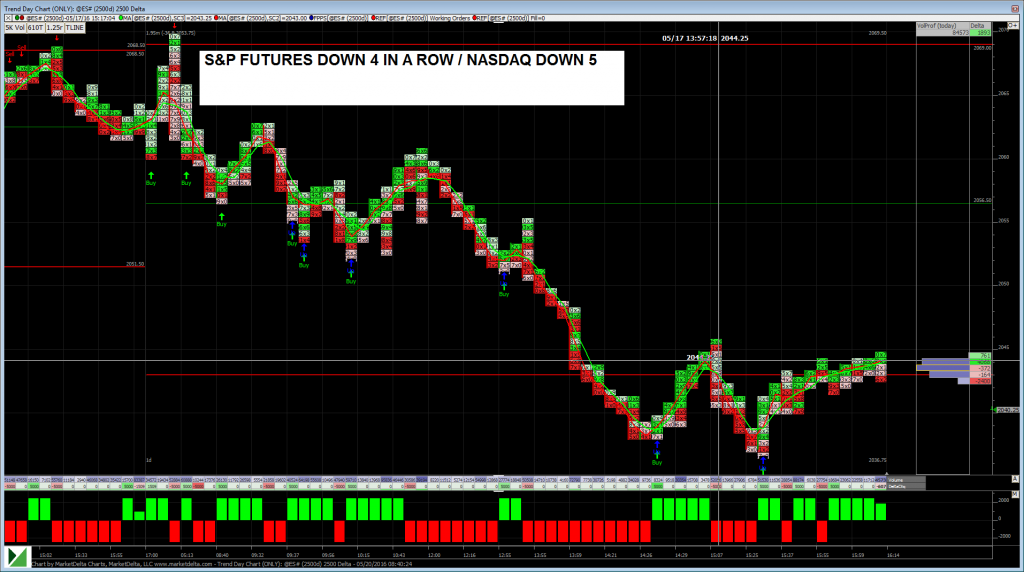
After some sharp sells and a push down to new lows at 2022, breaking the May 6th and April monthly low prints, the ES started to short cover back up to 2039 during the final hour yesterday. It was a great example of how the computers are designed to run the sell stops and then run the buy stops. After popping back up to the 2029-2030 level the ESM16 did an upside stop run going from the 2030.00 level, just 1 tick above the vwap, up to 2035.50 in just a matter of moments. The S&P has been weak due to the US Federal Reserve saying if current economic conditions continue to improve interest rates will move higher this year. There were a lot of ‘ifs’ in the Fed minutes, but to help guide you thru the June 24th meeting, you may want to look at this. The link is a free chart that shows the odds of a Fed rate hike based on Fed Funds Futures. Its currently running at 30% chance today and July is running higher.
Overnight the S&P 500 futures rallied modestly as worldwide equity markets have seen a bid. The ESM saw a trade as high as 2047.50, up 8.75 handles, into the Euro open but has mostly been offered since then, trading back to 2040.75 this morning. The ESM currently sits at 2042.75, up 4 handle, on just over 150K volume two hours before the cash open at 6:30 am cst.
Today’s calendar offers the existing home sales and not much more. Given the lower globex volume and the resilience of the S&P, as it keeps making new lows, to find new buyers, we see the possibility of some shorts throwing in the towel today heading into the weekend and May expiration, and to go out higher in a “thin to win” type grind. However, if spoos look weak early, Friday tends to be the most difficult day of the week to counter trend, so we expect that a weak first hour could lead to a weak close and a retouch of lower prices. Sellers have made a series of lower highs on the intraday charts and should be expected to give resistance here at the 2045-2050 area. In our view, bears cannot let the price above 2050 or there could be a run of sell stops to 2060, and even higher. The globex low is 2037.25 and if bulls cannot defend that, then there is nothing beneath until yesterday’s 2022 area.
Sell In May

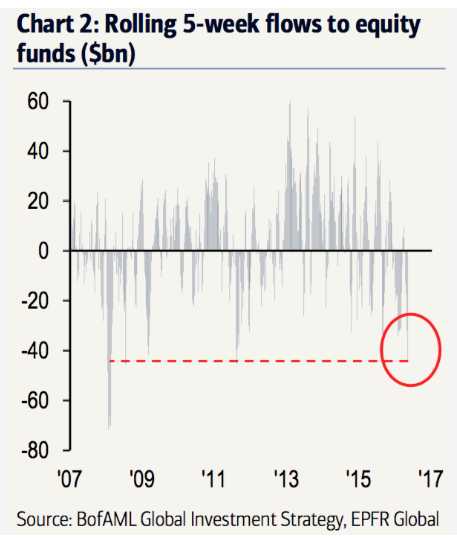
Bank of America/Merrill Lynch noted that over the last five weeks equity funds have seen $44 billion in outflows, the largest such outflow since the August 2011 correction and second most since the 2008 sell off. The move to risk off is not just seen in U.S. stocks, but international equity funds have seen a comparable sell off as well as bond funds,. Precious metals, most particularly gold, and money market funds have seen considerable inflows over the last month. Last year around this time MrTopStep began to note the outflows we saw based on the market-on-close imbalance orders and Lipper Fund Flows. When cash goes on the sidelines it often opens the doors for a stock market rally, but when too much cash is leaving and unwilling to participate in a rally then often the results are drastic, as we saw last year when the S&P experienced its first correction since 2011. All in all this year looks very similar to last year going into the summer. After a grind higher during April, the ESM16 failed at the 2100 level and is seeing money outflows and a price break down in May, on top of instability surrounding the Fed again this year. Our call going into the “end of the best six months for stocks” as May began was that this month would see a topping formation and lead to a summer range before a sell off at some point before autumn.
In Asia, 9 out of 11 markets closed higher (Shanghai +0.66%), and In Europe, 9 out of 11 open markets are trading higher this morning (DAX +0.83%). Today’s economic calendar is light and includes Existing Home Sales, and the Baker Hughes Rig Count.
Our view: Today is the May options expiration. The S&P futures have been up, down (mostly down) and all around. Can the Fed rate-hike headlines keep pushing the S&P lower? Sure, but if the current sell off holds, it should not be a problem going back to 2050-2060. It’s all a big game of catching people off base. The one thing that does concern me is the over $7 billion pulled from the mutual funds over the last week. That is not very encouraging. Today we have a light economic calendar but that doesn’t mean things won’t be whipping around.
As always, please use protective buy and sell stops when trading futures and options.
- E-mini S&P 5001986.25-12.00 - -0.60%
- Crude Oil
- Shanghai Composite
- Hang Seng19694.33-132.08 - -0.67%
- Nikkei 22516646.66+1.97 - +0.01%
- DAX 9823.54-119.69 - -1.20%
- FTSE 1006102.75-63.05 - -1.02%
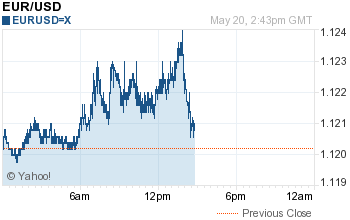
- Euro 1.1216

