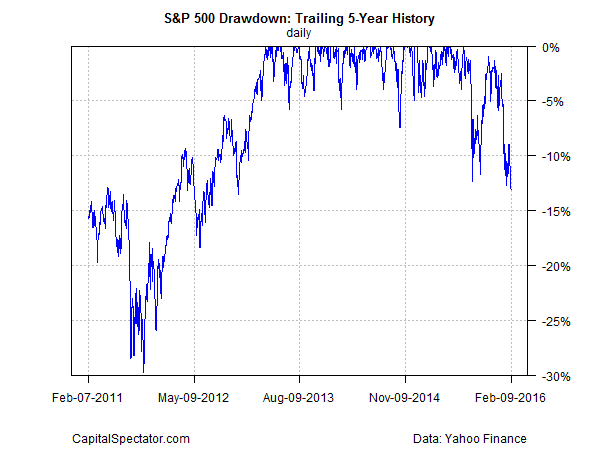
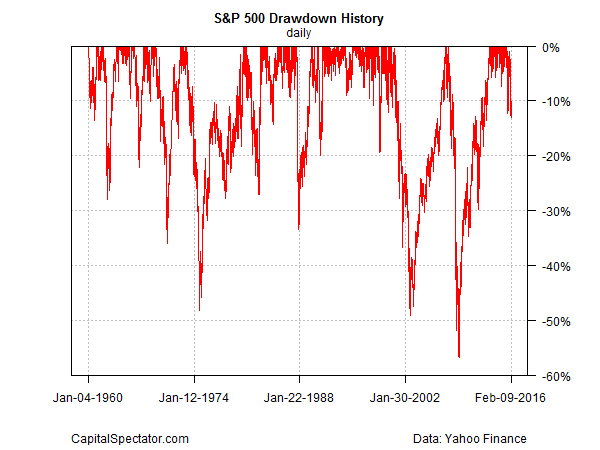
The positive bias to the US stock market over the long run means that drawdowns rarely exceed 10%. But this isn’t one of those times. The S&P 500 is posting a decline in excess of 10% from the market’s previous peak, offering one more sign that the trend is weak—the weakest, in fact, in several years, according to this metric.
Surprising? Perhaps not. The S&P 500 enjoyed several years with relatively brief and shallow drawdowns. In other words, the market has had a long stretch of quickly bouncing back and moving on to new highs after run-ins with the bears. But defying gravity can’t last forever, courtesy of mean reversion. The winning streak has hit a wall recently, as reflected in the return of drawdowns of 10%-plus in 2016. As of yesterday’s close (Feb. 10), the S&P 500 is nursing a drawdown of 13.1%–the steepest since 2012.
Drawdowns below 10% are in the minority, but not excessively so. Since 1960, peak-to-trough declines of 10% or more infect the historical record roughly 43% of the time.
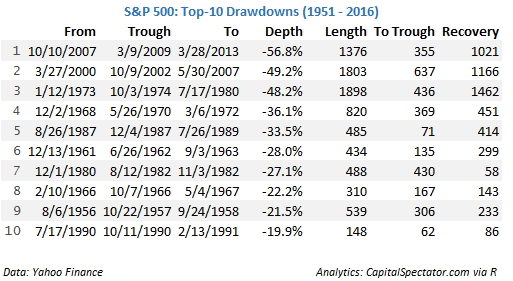
But that record is worrisome in the present because drawdowns below 10% tend to accompany extended periods of weakness compared with lesser declines. For some perspective, consider the top-10 drawdowns over the past 60-years-plus:
The current drawdown is still relatively mild next to the extremes in history. The question is whether the present decline has more room to run to the downside? No one knows, but it’s clear that we’re in a period of elevated risk—signaled in part by a drawdown that’s dipped below the garden-variety stumble.
The decisive factor will likely be bound up with the incoming economic data. Quite a lot if not most of the market’s slide of late is linked to macro worries. The numbers have been wobbly lately, but it’s still premature to make a high-confidence recession call for the US, as discussed in the recent business-cycle profile. That said, growth has decelerated lately and so the ability of the recovery to endure will fade into the red zone if the next round of numbers delivers downside surprises.
Meantime, market sentiment is inclined to see trouble these days. That alone isn’t the last word on the economy. But history suggests that if drawdown sinks deeper into the red beyond current levels, the odds will rise that there’s more than noise here. Mr. Market’s macro forecasts are far from flawless, of course. That’s especially true when we’re looking at any one market metric, which is why it’s prudent to monitor a diversified mix of indicators for estimating financial risk. That said, the market’s record with peak-to-trough declines as a window into the macro future looks a bit more impressive for those times when drawdown is well below the 10% mark for an extended period.


