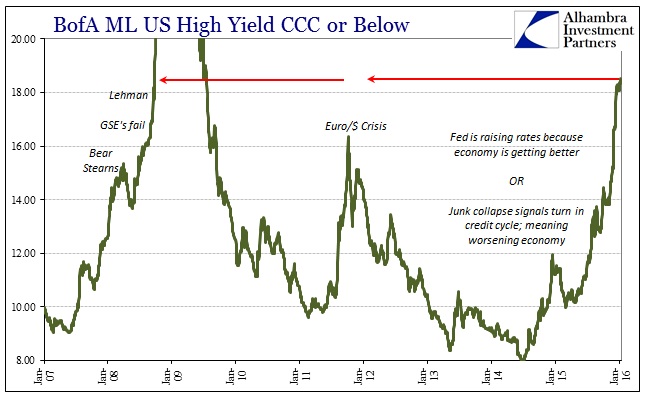
The fallout in liquidity and funding markets has been mostly attributed to the junk-bond bubble. Prices have fallen, and many precipitously, while yields have risen. But those are not the only negative factors being exhibited. If the issuance figures are anywhere close to correct, then increasingly junk obligors are being totally shut out at any price. Worse than that, however, is that the damage is not contained in just junk bonds (and leveraged loans).
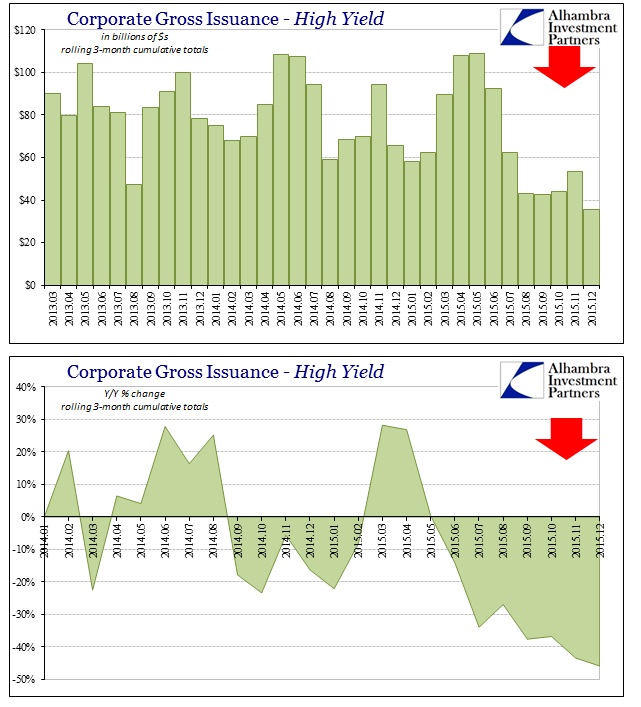
According to SIFMA, total gross issuance in December 2015 for high yield was just $3.5 billion – the lowest since August 2014’s $3.4 billion. For the quarter, gross issuance was down to $35.6 billion as compared to $65.7 billion in Q4 2014 and $78.4 billion in Q4 2013. That was the lowest three-month total in years. Clearly, the junk space is being pummeled by the gaining debacle in the junk bubble.
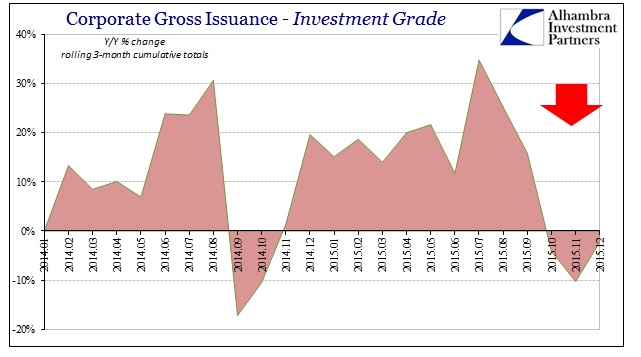
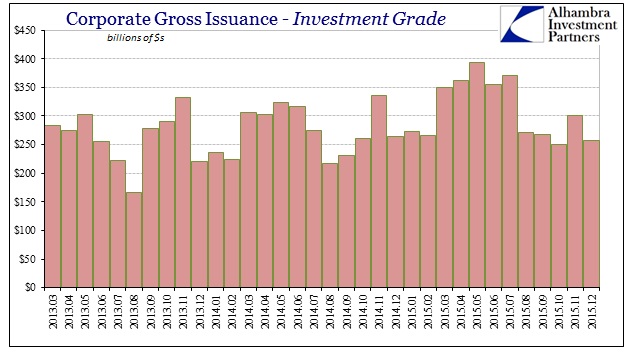
Investment-grade issuance has also fallen off, however. SIFMA reports just $51.1 billion gross last month compared to $56.1 billion in December 2014. It is possible that IG issuance has declined as many companies rushed to float bonds earlier in the year, but the timing (August) of this small runoff (to this point) may suggest it wasn’t a planned function.
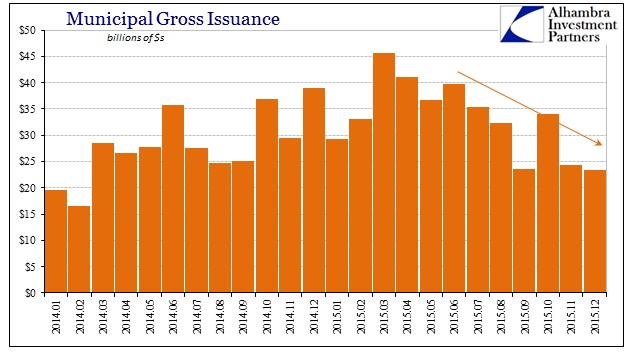
Further, there is initial evidence that other sectors are being affected, too. Gross muni issuance has also declined, if slightly, in recent months. Muni totals for December were $23.3 billion compared to $39 billion the December before. For the three months of Q4, there was gross of $81.7 billion vs. $91.2 billion Q3, $117.5 billion Q2, $108.1 billion Q1 and $105.5 billion Q4 2014. Undoubtedly, potential skittishness in the sector can be partially attributed to Puerto Rico’s unfolding default(s), but I don’t think that explains the full measure of the decline in gross; especially since that falloff occurred, like IG, suddenly after August last year.
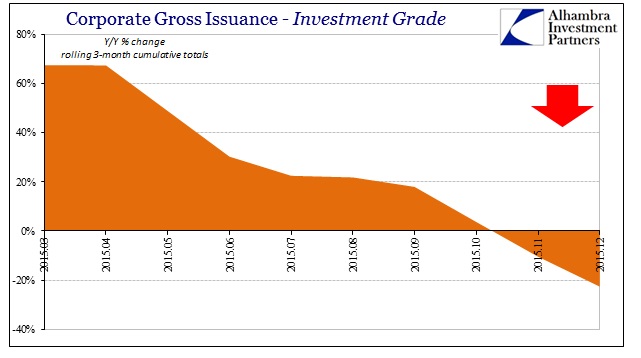
If we are talking about finance in the context of recession, this is one of the primary recessionary forces. Companies in HY that suddenly are unable to roll or obtain bond financing or leveraged loans are left with few other choices given their status and presence in that market in the first place. Such credit-based liquidity in economic terms has undoubtedly kept many firms afloat that might have otherwise already succumbed to the insufficient economic expansion especially past early 2012. But as these firms start to default and layoff, they will do so in non-linear fashion, which is what the crash in CCC suggests for the intermediate if not short term – once they start, look out.
While that would suggest serious recessionary consequences by itself, the potential addition of IG and even muni into the possible credit crunch is far more concerning; and in more ways than one. The inclusion of a potential broad-based credit disruption may explain the underperformance of the S&P Buyback Index since its late February record high. What was unquestionably a boost in the stock bubble, repurchasing, has swung instead to an anchor. Since February, the Buyback index has dramatically underperformed the overall S&P 500 – and even the NYSE Composite. That would seem to indicate, strongly, that what was once an overwhelming positive factor for prices is now the opposite.
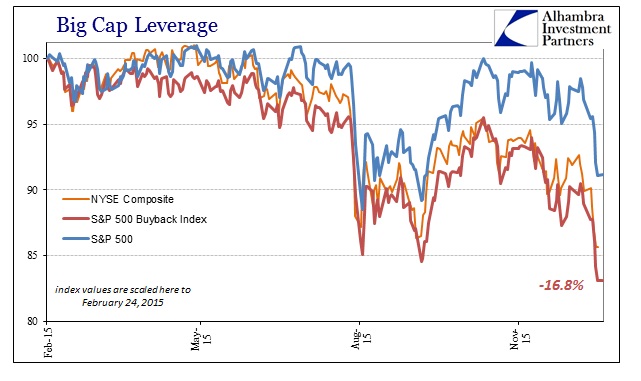
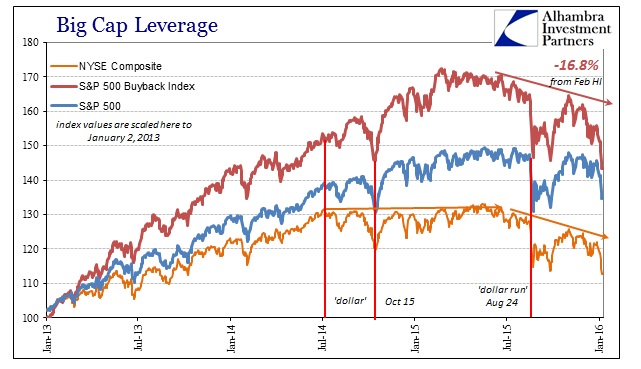
There are, of course, economic considerations factored into this current drag on Buyback performance but those earnings and cash flow downgrades would work in concert with credit-based liquidity for overall funding of buybacks in reversal. It suggests, particularly with how far the index has sunk since February, that the “market” is now keenly aware of the deficiencies in those companies exuberantly repurchasing their own stock that might no longer be papered over in debt-financed financial re-engineering. In terms of the credit cycle, a possible turn there seems to have forced a re-assessment in how “valuable” companies that have borrowed to achieve that re-engineering might be when they might no longer be able to do so readily and easily. It stands to reason that any such review would be tied to what we are seeing in issuance overall.
In other words, if the economy is as bad as it is already, with manufacturing staked to at least its own recession for some months now, what are we looking at with credit increasingly difficult to come by across-the-board? Maybe this is just temporary like what we saw in 2013, though I highly doubt it. Once the cycle turns it doesn’t come back; and that might be the most important point about junk bonds in issuance and in price. It’s already gone quite far in that direction, and the more it has the more broader indications and factors face the same difficult probabilities.
