Get 40% Off
🚨 Markets Are Down. Unlock Undervalued StocksFind Stocks Now

Risk-On Theme To Begin Fourth Of July Fireworks

Published 07/04/2014, 01:02 AM
Updated 07/09/2023, 06:31 AM

Since the lows of 2009, markets have been trending upward, generally, with a couple of pullbacks in 2010 and 2011.

From the Weekly comparison chart below of the Dow 30, S&P 500, Nasdaq 100, and Russell 2000 Indices, you can see how much markets have gained, percentage-wise, since those lows. The Nasdaq is in the lead, followed by the Russell, S&P, and the Dow, thanks to the Fed's monetary policy pertaining to financial price stability, inflation, and unemployment concerns.

Since Janet Yellen indicated in her speech to the IMF on July 2nd that their monetary policy does not need to deviate from those concerns, I'd expect this bull market to, basically, continue until that changes. There may be periods of volatility over the next year or two that may be influenced by world incidents, or even by month-to-month economic data, especially concerning inflation or corporate earnings, but until we see any political uncertainty arise in the markets closer to the U.S. Presidential election in 2016, we may see a steady climb continue.
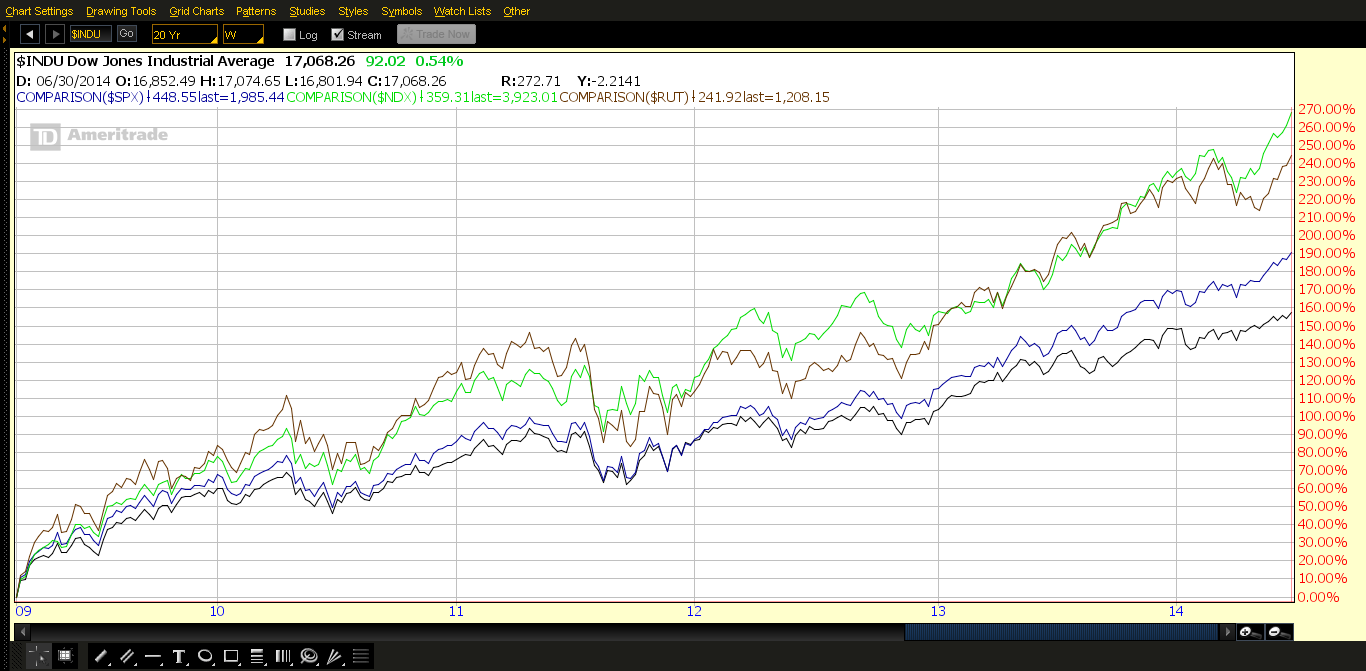
Dow Jones Industrials

The next Weekly chart is the ratio of the SPX:VIX. This week's trading closed above near-term resistance of 180.00 and Momentum made another higher (all-time) swing high. Price may fluctuate between 180.00 and 150.00 before a further climb is made, if the 180.00 level (now near-term support) is breached.
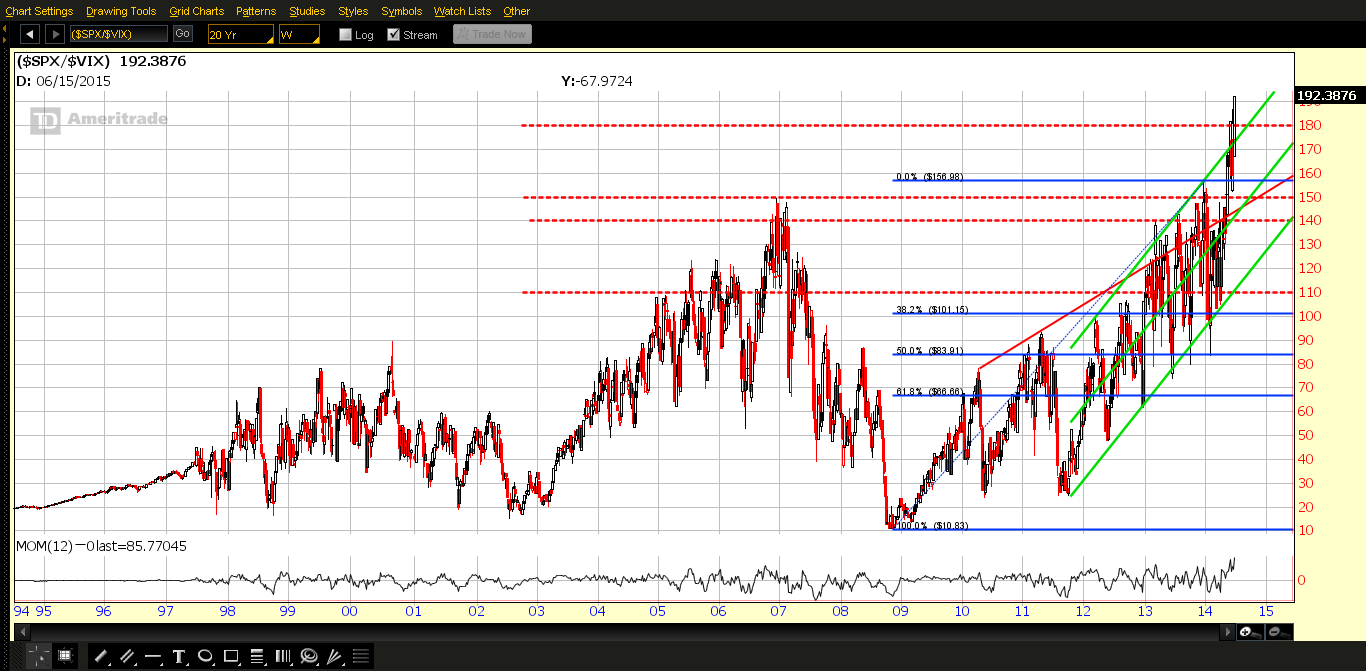
SPX vs VIX Weekly Overview

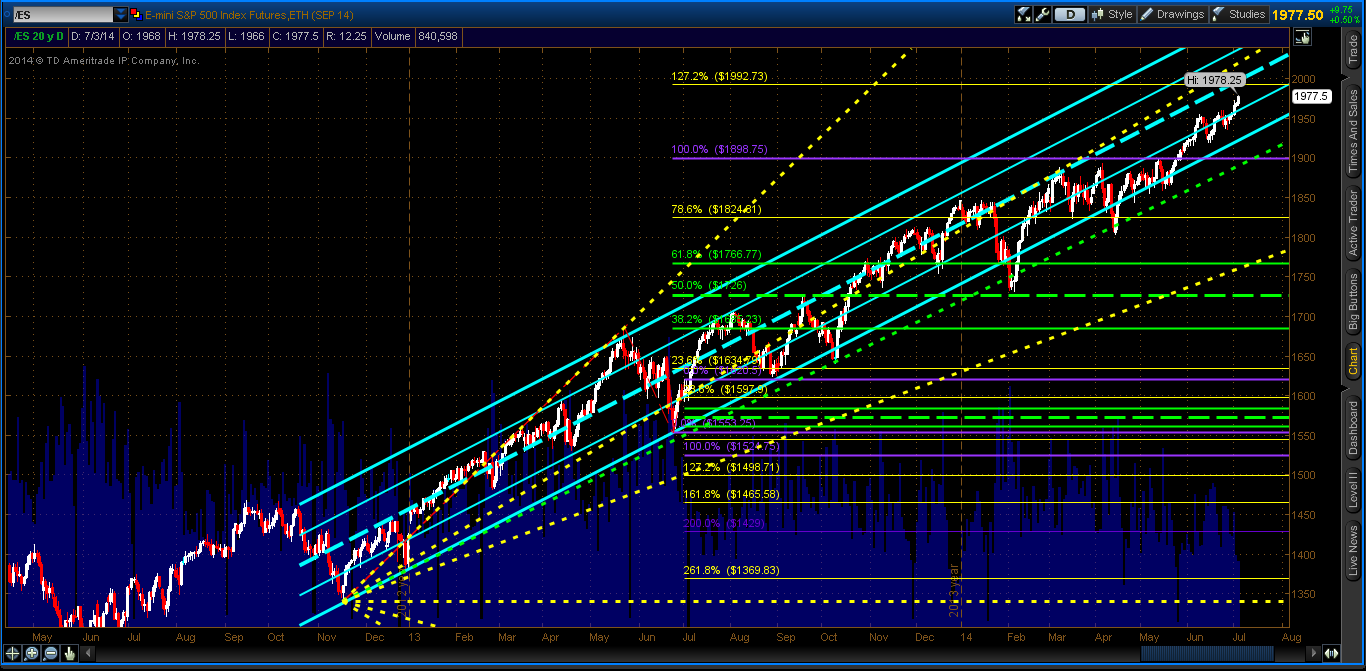
The following Daily chart of the S&P 500 E-mini Futures Index (ES) shows a steady climb upward in its channel from the 2013 breakout towards a confluence of the channel median with a Fibonacci Fanline and a Fibonacci extension level around the 1990 or 2000 level, as I mentioned in my post of June 9th (I was a little early in my projected date of the end of June for this target).

One thing I'm noticing on this chart is the drop-off in volumes. This is one to watch over the coming days/weeks to see if this trend continues, whether it has any effect on this upward climb, or whether we see more volumes pour into the Nasdaq and Russell Indices to confirm a full "Risk-On" scenario. This latter scenario would become evident over time on the comparison chart above, another one to watch.

3rd party Ad. Not an offer or recommendation by Investing.com. See disclosure here or remove ads .
ES 20 Year Overview Daily

Latest comments

Risk Disclosure: Trading in financial instruments and/or cryptocurrencies involves high risks including the risk of losing some, or all, of your investment amount, and may not be suitable for all investors. Prices of cryptocurrencies are extremely volatile and may be affected by external factors such as financial, regulatory or political events. Trading on margin increases the financial risks.
Before deciding to trade in financial instrument or cryptocurrencies you should be fully informed of the risks and costs associated with trading the financial markets, carefully consider your investment objectives, level of experience, and risk appetite, and seek professional advice where needed.
Fusion Media would like to remind you that the data contained in this website is not necessarily real-time nor accurate. The data and prices on the website are not necessarily provided by any market or exchange, but may be provided by market makers, and so prices may not be accurate and may differ from the actual price at any given market, meaning prices are indicative and not appropriate for trading purposes. Fusion Media and any provider of the data contained in this website will not accept liability for any loss or damage as a result of your trading, or your reliance on the information contained within this website.
It is prohibited to use, store, reproduce, display, modify, transmit or distribute the data contained in this website without the explicit prior written permission of Fusion Media and/or the data provider. All intellectual property rights are reserved by the providers and/or the exchange providing the data contained in this website.
Fusion Media may be compensated by the advertisers that appear on the website, based on your interaction with the advertisements or advertisers.
© 2007-2024 - Fusion Media Limited. All Rights Reserved.